<iframe style="width:120px;height:240px;" marginwidth="0" marginheight="0" scrolling="no" frameborder="0" src="//ws-na.amazon-adsystem.com/widgets/q?ServiceVersion=20070822&OneJS=1&Operation=GetAdHtml&MarketPlace=US&source=ss&ref=as_ss_li_til&ad_type=product_link&tracking_id=peaceinvesting-20&language=en_US&marketplace=amazon®ion=US&placement=0060555661&asins=0060555661&linkId=80f8e3b229e4b6fdde8abb238ddd5f6e&show_border=true&link_opens_in_new_window=true"></iframe>|<iframe style="width:120px;height:240px;" marginwidth="0" marginheight="0" scrolling="no" frameborder="0" src="//ws-na.amazon-adsystem.com/widgets/q?ServiceVersion=20070822&OneJS=1&Operation=GetAdHtml&MarketPlace=US&source=ss&ref=as_ss_li_til&ad_type=product_link&tracking_id=peaceinvesting-20&language=en_US&marketplace=amazon®ion=US&placement=1119404509&asins=1119404509&linkId=0beba130446bb217ea2d9cfdcf3b846b&show_border=true&link_opens_in_new_window=true"></iframe>|<iframe style="width:120px;height:240px;" marginwidth="0" marginheight="0" scrolling="no" frameborder="0" src="//ws-na.amazon-adsystem.com/widgets/q?ServiceVersion=20070822&OneJS=1&Operation=GetAdHtml&MarketPlace=US&source=ss&ref=as_ss_li_til&ad_type=product_link&tracking_id=peaceinvesting-20&language=en_US&marketplace=amazon®ion=US&placement=1119376629&asins=1119376629&linkId=2f1e6ff64e783437104d091faaedfec7&show_border=true&link_opens_in_new_window=true"></iframe>
Below is a stock return calculator and ADR return calculator which automatically factors and calculates dividend reinvestment (DRIP). Additionally, you can simulate daily, weekly, monthly, or annual periodic investments into any stock and see your total estimated portfolio value on every date.
There are thousands of American stocks and ADRs in the database. Data is accurate to within the last 7 days.
Stock Total Return and Dividend Reinvestment (DRIP) Calculator
Interactive Content Here: Visit on DQYDJ to view.
Note: The calculator does not account for spin-offs. Split adjustments happen within a week. New listings and ticker changes may take longer.
How To Use the Dividend Calculator (DRIP)
To begin, you need to enter at least a stock ticker. As you type, it will search through legal stock tickers to help you complete the field and explore the set.
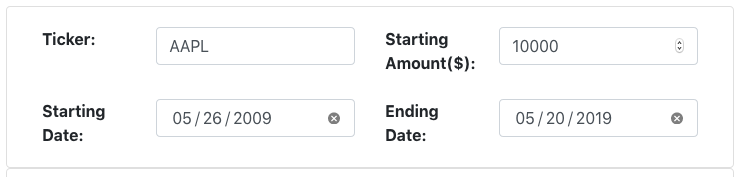
Basic options for stock portfolio value modeling.
- Stock Ticker: Enter a valid, active stock ticker [ZIP] from Tiingo
- Starting Amount ($): Enter an initial investment amount, in dollars
- Starting Date: Enter when an investment was first made*
- Ending Date: Enter when an investment was sold*
° Depending on the stock data, we might adjust the starting and ending date. Check carefully after modeling a scenario.
Advanced Dividend and Periodic Investment Options
Advanced options concentrating on dividend events and periodic investments
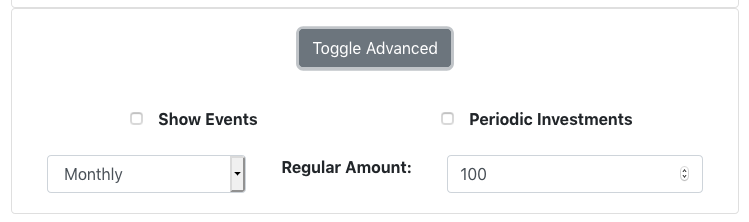
Click the 'Toggle Advanced' button to open the advanced stock options panel.
- Show Events: Check the box for a listing of every dividend on that ticker in our database. If you choose to simulate periodic investments, they will be added as well.
- Periodic Investments: Select the box to create a reinvestment scenario for a given ticker.
- "Monthly": If you are simulating periodic investments, select how often you would have invested in the stock.
- Regular Amount: The amount invested every period selected from the left pull-down below it. (Such as in a DRIP or Dividend Reinvestment Plan)
Interpreting Portfolio Model Results
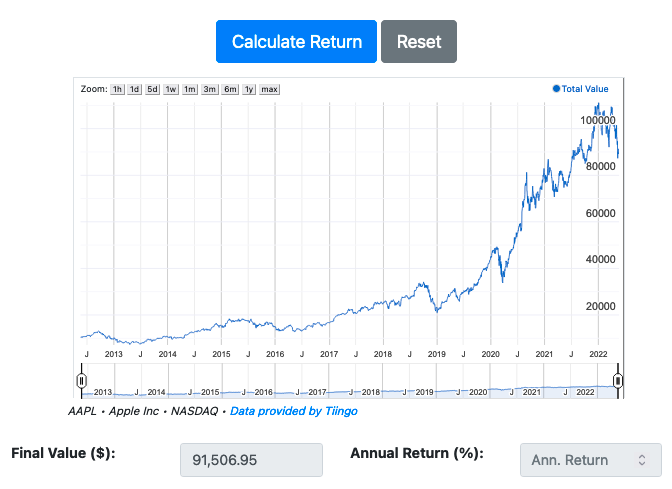
Results of the total return calculator for an investment
- Final Value ($): The value of the investment on the 'Ending Date'.
- Annual Return: Our estimate to the annual percentage return by the investment, including dollar cost averaging. (Also see our compound annual growth calculator)
- Graph: The value of the stock investment over time. Note – if you are on desktop – you can drag over the graph to see the value of the portfolio on any day.
How do the periodic stock investments work?
The tool attempts to time dividends based upon the ex-dividend date of stocks in our database. Where the tool sees a dividend, it invests at the daily open price. All other prices in the tool, such as the final portfolio value and daily updates, are based on close price.
When you choose to model periodic investments, the tool in shorthand invests every 1, 7, 30, or 365 days, respectively. (Read: no accounting for leap years!). Where we register a dividend and investment on the same day, the investment goes in at the open price but (as you'd expect), it doesn't factor into the dividend amount.
Remember, "past performance is no guarantee of future results"!
If you see a previously successful investment (maybe especially if you do!), don't extrapolate gains to the sky.
Stock valuation is art more than science. Value investors try to model a fair value based on the characteristics of the company – especially financials and cash flows. Along value lines, we have a few tools for you to attempt to value stocks:
- A Graham Number Calculator which uses Benjamin Graham's method to estimate a fair price.
- A Discounted Cash Flow Calculator which uses estimated future earnings or cash flow growth to estimate the fair value of a stock or investment.
- A Dividend Discount Model Calculator which also estimates net present value like the DCF calculator, but uses dividend history and growth instead.
There are no guarantees in stock valuation - it's hard to predict the future. However, those tools might help point you in the right direction.
Source and Methodology of the Stock Total Return Calculator
The tool uses the Tiingo API on the backend. Tiingo is a paid API provider, so we have some (light) limitations in place:
- Stock data may be up to 7 days old.
- There are rate limits in place for your usage:
- Maximum 50 scenarios per day
- Maximum 10 scenarios per minute
- The tool doesn't – and can't – account for spinoffs
Limitations and Disclaimers
The stock total return calculated is idealized, based on closing prices and unrealistic dividend timing, and will never match exact returns.
The tool is for informational purposes only and we cannot warrant the results. Verify any information you gather from this tool on your own. Treat the stock data as initial research.
We are not modeling taxes, management fees, dividend payment timing, slippage, and other sources of error. It is possible that the dataset contains errors as well.
Bug Reports, Feature Requests, and Requests to Help with the Stock Total Return Calculator
Let me know if you find a bug. Include which ticker caused the issue so I can debug the data.
As for enhancements: outside of ads, I'm not compensated to build and maintain this tool. If you have significant feature requests, make a contracting inquiry.
We wish we could help you with your stock research questions. Unfortunately, we have to stress that this information is for informational and research purposes only. We will not respond to requests to provide investment returns in a legal capacity. We can only help you with research inquiries.
(You probably need a professional known as a "forensic accountant" for legal purposes.)
Musings on the Any Stock Dividend Reinvestment Calculator
We originally built a version of this stock total return calculator for DQYDJ's five year anniversary (and 749th published article). That was in 2014.
Years into the tool (and even more into some of our others) we continue to stress that you need to produce fair, dividend reinvested return comparisons when discussing investments. That means this tool aligns philosophically with the other dividend reinvestment tools we have elsewhere on the site.
Try comparing your results to one of these (with inflation adjustments turned off):
- Dow Jones Industrial Average Calculator
- ETF and CEF Return Calculator
- S&P 500 Calculator
- Wilshire 5000 Calculator
- 10-Year Treasury Calculator
- Any House Return Calculator (Seeded with median prices)
- Bitcoin Return Calculator (Yep...)
- Mutual Fund Return Calculator
As for styles of investing, we think the best thing to do with a windfall is so invest a lump sum. For investing from your paycheck, we suggest dollar cost averaging. To model a future investment, use the investment calculator.
Adjust Your Returns for Total Returns
Even though we've been fighting this battle for years, price returns still get all the press.
Price is only one element of return, however. Stocks payout dividends in dollars per share or in new shares of stock; simply quoting price returns misses a real (and significant!) portion of total returns.
It is especially egregious when companies pay special dividends. These can be massive payouts that (if ignored) would look like a massive overnight loss.
With this calculator, skip the half-truths and run your scenarios directly. All you need to provide is a ticker and some dates, and we'll do the total return math for you.
We hope you enjoy the any stock dividend reinvestment calculator. If you see articles quoting price returns on dividend paying stocks - send them our way, deal?
The post Stock Total Return and Dividend Reinvestment Calculator (US) appeared first on DQYDJ – Don't Quit Your Day Job....
||
----------------------------
By: PK
Title: Stock Total Return and Dividend Reinvestment Calculator (US)
Sourced From: dqydj.com/stock-return-calculator/
Published Date: Thu, 19 May 2022 03:29:03 +0000
Read More
.png) InvestingStocksToolsClubsVideosPrivacy PolicyTerms And Conditions
InvestingStocksToolsClubsVideosPrivacy PolicyTerms And Conditions
