||
If you would look at the different types of trading strategies, you would notice that there two common themes among these strategies. Strategies are either reversal strategies or continuation strategies. Most strategies fall into either one of these classifications. Some fall on one end of the spectrum and some on the other end of the spectrum. Either type of strategy could work very well when used properly in the right market condition.
Different traders look at the market differently. One trader might use a reversal type of strategy, while another trader may look at it as an opportunity for a continuation type of strategy. This battle between traders who have positioned their trades for a reversal and traders who have positioned their trades for a continuation cause price to move in either direction. The market moves in the direction where most traders place their bets on. Position your trade against the bulk of the market and you would be on the losing end of the market.
However, there is a way to position yourself right in the middle of both camps. Traders can trade a strategy which is both a continuation opportunity and a reversal opportunity. The market can be an opportunity for a trend continuation strategy on the long-term and also be a mean reversal strategy on the short-term. Trading in this manner allows traders to trade with the bulk of the market, which significantly increases the win probability of each trade.
Carter MA
Carter MA is a custom trend following technical indicator which is based on moving averages. In fact, this indicator is composed of a set of moving averages which are set at different period lengths.
This indicator plots several moving averages in order to help traders see the big picture in terms of trend direction. The different moving averages have different period lengths which it derives it figures from in order to represent the varying trends from short-term to long-term.
The solid red line is based on a 200-period moving average, which is commonly used as a long-term trend indicator. The dotted red line is based on a 100-period moving average, which represents the mid-long-term trend. The blue line is based on a 50-period moving average, which is widely used as a mid-term trend indicator. The green line is based on a 21-period moving average, which represents a mid-short-term trend. The sienna line is based on an 8-period moving average, which represents the short-term trend.
Trend direction can be identified based on how the moving average lines are stacked. Having the shorter-term moving averages above the longer-term moving averages indicate a bullish trend bias. Having the shorter-term moving averages below the longer-term moving averages indicate a bearish trend bias. Moving averages that are crossing over each other indicate that the market could be reversing. Moving averages that are not clearly stacked indicate a market that is ranging or a market that is moving erratically.
Stochastic Cross Alert
The standard Stochastic Oscillator is a popular momentum indicator which plots two lines that oscillate from 0 to 100. Momentum direction is identified based on how the two lines overlap. A bullish momentum is identified if the faster line is above the slower line. Inversely, a bearish momentum is identified if the faster line is below the slower line. Crossovers between the two lines are then interpreted as momentum reversal signals.
The range of the Stochastic Oscillator also typically has markers at level 20 and 80. Lines dropping below 20 indicate an oversold market, while lines breaching above 80 indicate an overbought market. Both conditions are prime for mean reversals. Crossovers occurring on these areas are high probability mean reversal signals.
The Stochastic Cross Alert indicator is a signal indicator based on the mean reversal concept of the Stochastic Oscillator. It identifies mean reversal signals based on crossovers occurring below 20 or above 80. It then plots an arrow pointing the direction of the mean reversal, which traders can use as a mean reversal setup entry signal.
Trading Strategy
Carter MA Forex Trading Strategy is a combination of a trend following strategy and a mean reversal strategy.
In this strategy, trend direction is identified based on how the moving averages are stacked. Moving averages should also start to fan out indicating that the trend is strengthening.
Then, we wait for price pullbacks.
Price pullbacks can cause the sienna line to temporarily cross over the green line. However, the price action should respect the blue line as a dynamic support or resistance.
The pullback should then cause the Stochastic Oscillator to be overbought or oversold. Trades are confirmed as soon as the Stochastic Cross Alert indicator plots an arrow indicating the resumption of the trend.
Indicators:
- Carter_MA
- Stochastic_Cross_Alert
Preferred Time Frames: 30-minute, 1-hour and 4-hour charts
Currency Pairs: FX majors, minors and crosses
Trading Sessions: Tokyo, London and New York sessions
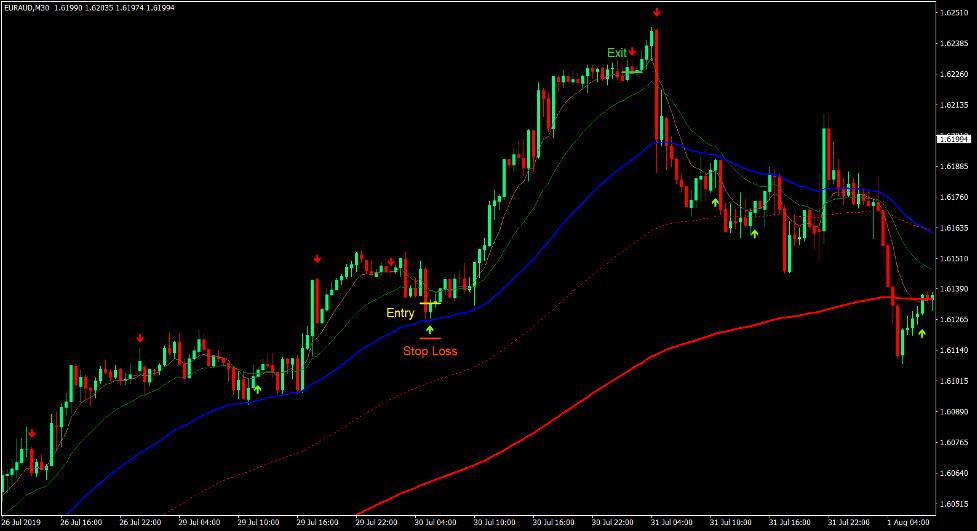
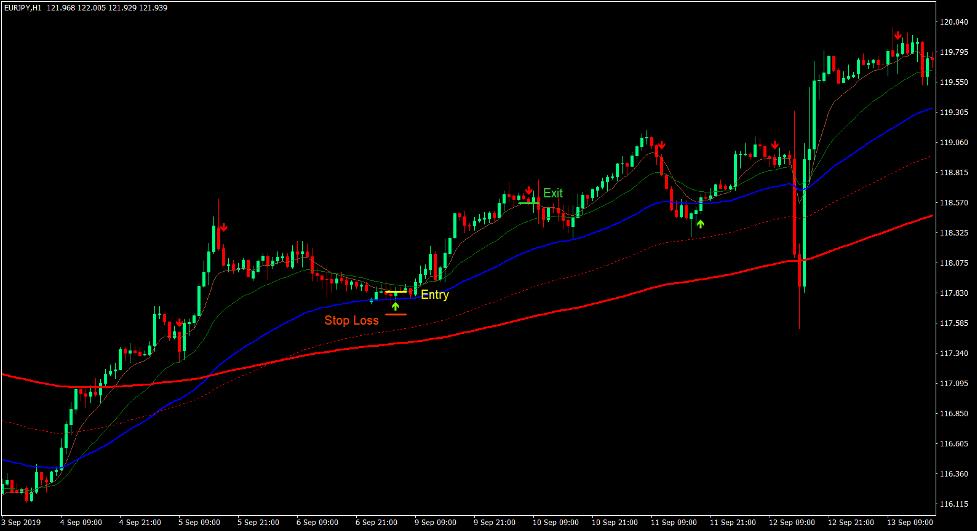
Buy Trade Setup
Entry
- The shorter-term moving average lines of the Carter MA should be above the longer-term moving average lines.
- Price action should be above the blue moving average line.
- Price should pullback towards the area of the blue moving average line.
- Enter a buy order as soon as the Stochastic Cross Alert indicator plots an arrow pointing up.
Stop Loss
- Set the stop loss below the arrow.
Exit
- Close the trade as soon as the Stochastic Cross Alert indicator plots an arrow pointing down.
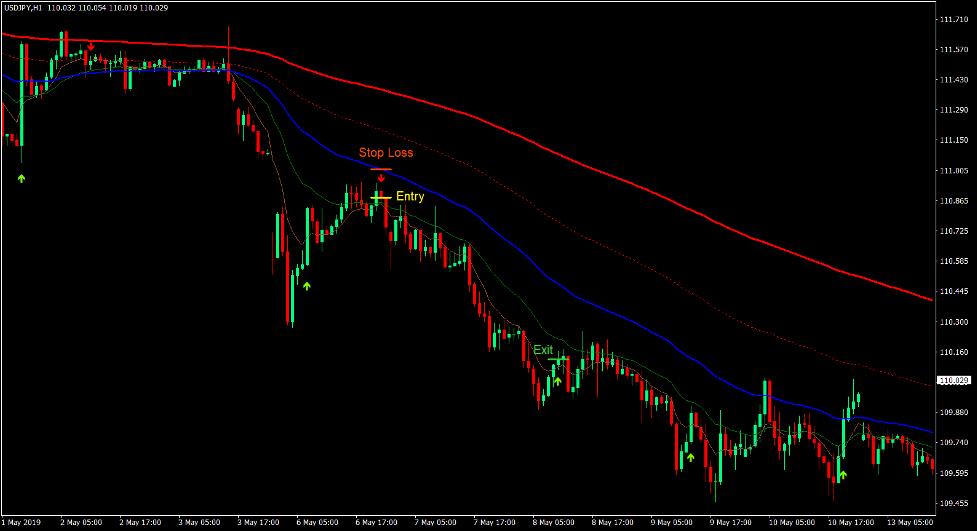
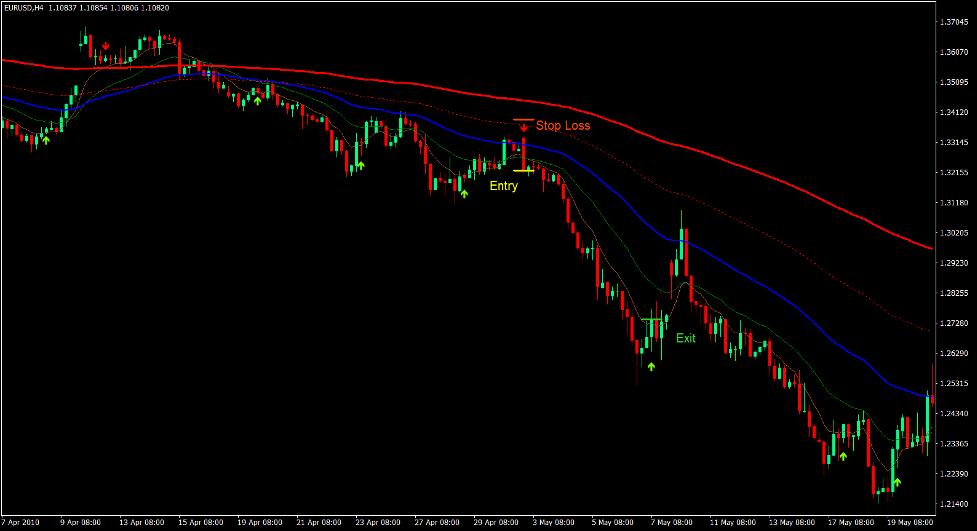
Sell Trade Setup
Entry
- The shorter-term moving average lines of the Carter MA should be below the longer-term moving average lines.
- Price action should be below the blue moving average line.
- Price should pullback towards the area of the blue moving average line.
- Enter a sell order as soon as the Stochastic Cross Alert indicator plots an arrow pointing down.
Stop Loss
- Set the stop loss above the arrow.
Exit
- Close the trade as soon as the Stochastic Cross Alert indicator plots an arrow pointing up.
Conclusion
This trading strategy is an excellent trading strategy because it combines both a trend following strategy and a mean reversal strategy.
This trading strategy should be used in a market that trending strongly on the long-term. Price should also respect the 50-period moving average line to confirm that the market is still trending and is not due for a deep reversal.
Trade setups should occur near the area between the green and blue lines as this area should act as an area of dynamic support or resistance.
If used in the right market condition, this strategy has the potential to produce consistent profits over the long run.
Forex Trading Strategies Installation Instructions
Carter MA Forex Trading Strategy is a combination of Metatrader 4 (MT4) indicator(s) and template.
The essence of this forex strategy is to transform the accumulated history data and trading signals.
Carter MA Forex Trading Strategy provides an opportunity to detect various peculiarities and patterns in price dynamics which are invisible to the naked eye.
Based on this information, traders can assume further price movement and adjust this strategy accordingly.
Recommended Forex MetaTrader 4 Trading Platform
- Free $50 To Start Trading Instantly! (Withdrawable Profit)
- Deposit Bonus up to $5,000
- Unlimited Loyalty Program
- Award Winning Forex Broker
- Additional Exclusive Bonuses Throughout The Year

>> Claim Your $50 Bonus Here <<
Click Here for Step-By-Step XM Broker Account Opening Guide
How to install Carter MA Forex Trading Strategy?
- Download Carter MA Forex Trading Strategy.zip
- *Copy mq4 and ex4 files to your Metatrader Directory / experts / indicators /
- Copy tpl file (Template) to your Metatrader Directory / templates /
- Start or restart your Metatrader Client
- Select Chart and Timeframe where you want to test your forex strategy
- Right click on your trading chart and hover on “Template”
- Move right to select Carter MA Forex Trading Strategy
- You will see Carter MA Forex Trading Strategy is available on your Chart
*Note: Not all forex strategies come with mq4/ex4 files. Some templates are already integrated with the MT4 Indicators from the MetaTrader Platform.
Click here below to download:
Save
Save
Get Download Access
||
-----------------------------------------------------
By: Tim Morris
Title: Carter MA Forex Trading Strategy
Sourced From: www.forexmt4indicators.com/carter-ma-forex-trading-strategy/?utm_source=rss&utm_medium=rss&utm_campaign=carter-ma-forex-trading-strategy
Published Date: Fri, 03 Mar 2023 11:45:47 +0000
Read More
Did you miss our previous article...
https://peaceofmindinvesting.com/tools/ipo-of-beamr-imaging-indemand-compression-technology
.png) InvestingStocksToolsClubsVideosPrivacy PolicyTerms And Conditions
InvestingStocksToolsClubsVideosPrivacy PolicyTerms And Conditions
