Have you ever felt like the market is a step ahead of you? Traditional moving averages can leave you lagging behind price movements, making it tricky to pinpoint entry and exit points for trades. But fear not, fellow trader! The DEMA (Double Exponential Moving Average) indicator is here to empower you with sharper signals and a more responsive approach to technical analysis in MT4.
This in-depth guide will equip you with everything you need to know about the DEMA indicator. We’ll delve into its origins, mechanics, and practical applications within the MT4 platform. So, buckle up and get ready to unlock the secrets of this powerful trading tool!
Unveiling the DEMA Indicator
The DEMA indicator might sound like a fancy technical term, but its core concept is surprisingly straightforward. It essentially acts as a smoothed-out version of the traditional Exponential Moving Average (EMA). But why go through the extra steps? Traditional EMAs, while valuable, can suffer from a bit of a delay in reflecting price changes. This lag can lead to missed opportunities or even costly false signals.
The DEMA tackles this issue by applying a double-smoothing technique. Imagine it like this: you first calculate a single EMA based on the closing prices. Then, you take that EMA and calculate another EMA based on it! This double dose of smoothing filters out some of the market noise, resulting in a more responsive indicator that reacts faster to price movements.
The inventor of the DEMA, Patrick Mulloy, introduced it in 1994 specifically to address the lag issue inherent in traditional moving averages. His goal was to create a tool that could help traders identify trends and potential reversals more effectively. Here’s the bottom line: the DEMA offers a smoother and more responsive alternative to traditional EMAs, potentially giving you an edge in navigating the ever-changing market landscape.
Demystifying the DEMA Formula
Now, let’s get a bit more technical. Understanding the formula behind the DEMA can provide valuable insights into its behavior. Here’s the equation:
DEMA (today) = (EMA (yesterday) x smoothing factor) + ((1 – smoothing factor) x Close price (today))
Don’t worry, we’ll break it down!
- EMA: This refers to the DEMA value from the previous trading day.
- Smoothing factor: This value, typically between 0 and 1, determines the responsiveness of the DEMA. A higher smoothing factor leads to a smoother but potentially less reactive indicator, while a lower value results in a more responsive but potentially more volatile indicator.
- Close price (today): This represents the closing price of the security for the current trading day.
Essentially, the DEMA takes a weighted average of the previous day’s DEMA and the current day’s closing price. The smoothing factor acts as a dial, controlling how much weight is given to each component.
Decoding the DEMA’s Signals
The DEMA empowers you with valuable insights, but deciphering its signals takes practice. Here are some key interpretations to keep in mind:
- Identifying Trends: A steadily rising DEMA suggests an upward trend, while a consistently falling DEMA indicates a downtrend. This can help you confirm existing trends or spot potential trend reversals early on.
- Spotting Trend Reversals: When the price action breaks above a rising DEMA, it might signal a bullish breakout. Conversely, a price break below a falling DEMA could hint at a bearish breakdown. These crossovers can be valuable entry or exit points for your trades.
- Divergences: Sometimes, the DEMA might diverge from the price action. For instance, a rising DEMA accompanied by flat or falling prices could indicate a weakening uptrend. Conversely, a falling DEMA with rising prices might suggest a potential trend reversal. However, divergences should be used in conjunction with other technical indicators for confirmation.
Crafting Your Trading Strategy
Now that you’ve grasped the DEMA’s language, let’s explore how to integrate it into your trading strategy. Here are a few effective approaches:
- Combining DEMA with Other Indicators: The DEMA shines when used alongside other technical tools. For instance, you can combine it with the Relative Strength Index (RSI) to gauge potential overbought or oversold conditions. Alternatively, pairing the DEMA with the Moving Average Convergence Divergence (MACD) can help identify trend strength and potential reversals.
- DEMA-Based Support and Resistance: The DEMA can act as a dynamic support or resistance level. A consistently rising DEMA might act as support, preventing prices from falling too sharply. Conversely, a falling DEMA could function as resistance, potentially hindering price advances.
- DEMA for Scalping and Day Trading: Due to its responsiveness, the DEMA can be a valuable tool for scalping and day trading. By monitoring short-term price movements and DEMA interactions, you can potentially capitalize on intraday opportunities.
It’s crucial to remember: There’s no one-size-fits-all strategy. Backtest different approaches using historical data to find what works best for your trading style, risk tolerance, and market conditions.
Expanding Your DEMA Expertise
Now that you’ve unlocked the secrets of the DEMA indicator, here are some additional tips and resources to solidify your knowledge and elevate your trading game:
-
Practice Makes Perfect: Don’t jump into live trading right away. Utilize MT4’s demo account to practice interpreting DEMA signals and experiment with different strategies in a risk-free environment.
-
Refine Your Settings: The optimal DEMA period and other settings can vary depending on the market you’re trading and your timeframe. Backtest different configurations to find the sweet spot that aligns with your goals.
-
Beyond Moving Averages: While the DEMA offers valuable insights, explore other technical indicators like the RSI, MACD, and Bollinger Bands. A well-rounded understanding of various tools empowers you to make more informed decisions.
How to Trade with DEMA Indicator
Buy Entry
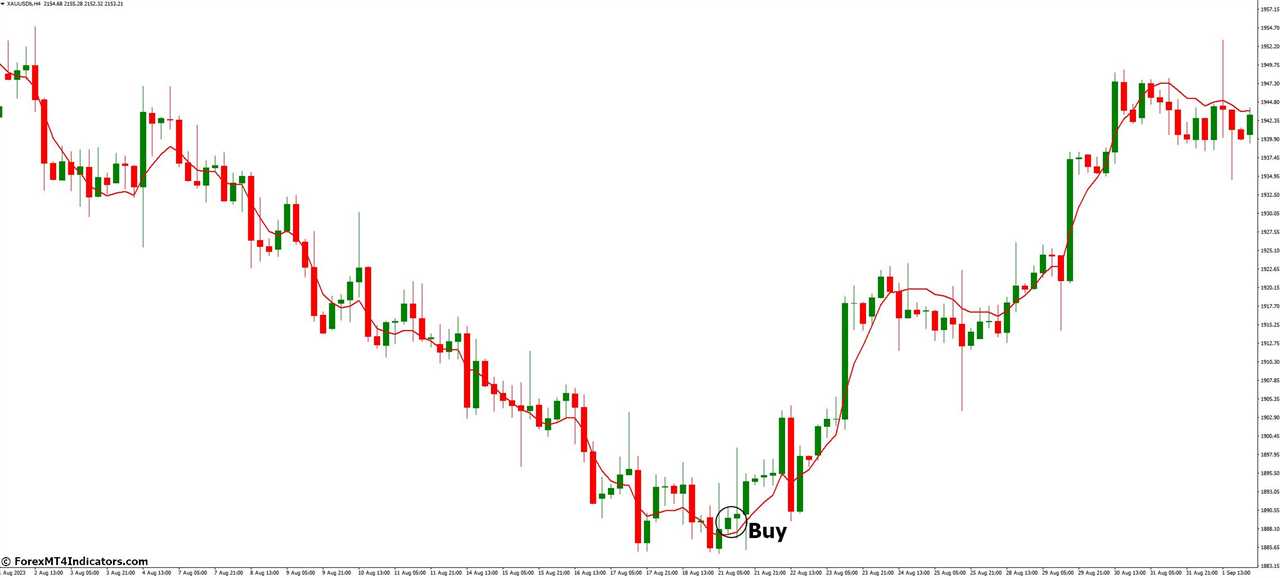
- Long DEMA Crossover: Look for a situation where the price action breaks above a rising DEMA. This might signal a potential uptrend.
- Entry: Enter a long position (buy) after the price closes above the DEMA.
- Stop-Loss: Place a stop-loss order below the recent swing low or the DEMA itself (depending on volatility).
- Take-Profit: Consider taking profits when the price reaches a resistance level, or when the DEMA starts to flatten or turn downwards.
Sell Entry
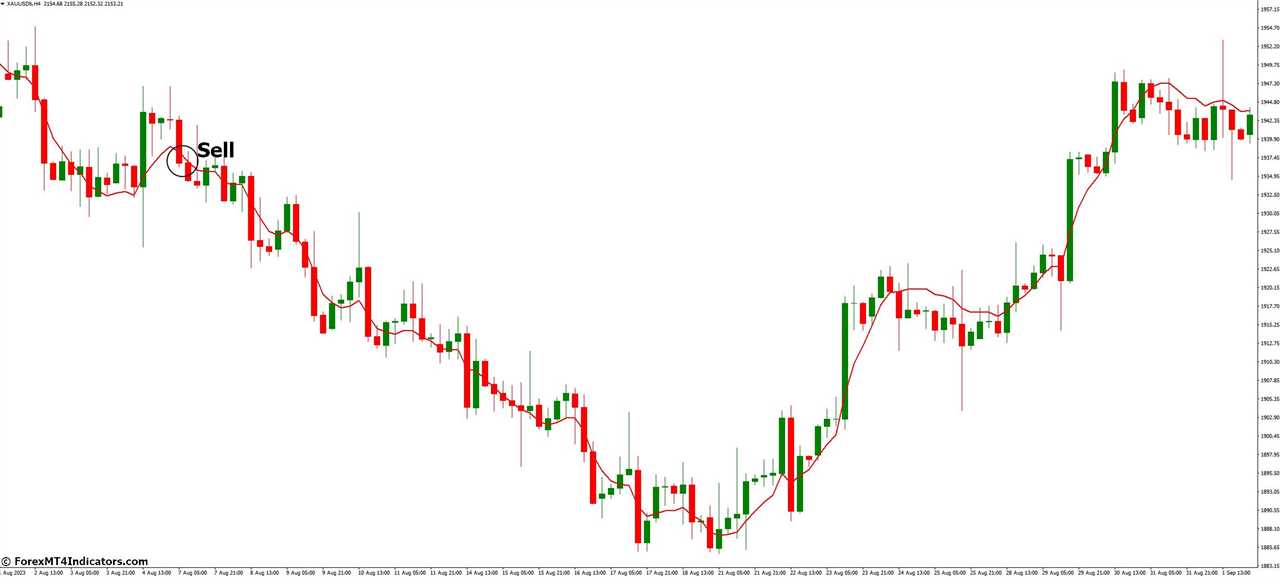
- Short DEMA Crossover: Conversely, watch for the price action to break below a falling DEMA, which could indicate a downtrend.
- Entry: Enter a short position (sell) after the price closes below the DEMA.
- Stop-Loss: Place a stop-loss order above the recent swing high or the DEMA itself (depending on volatility).
- Take-Profit: Consider taking profits when the price reaches a support level, or when the DEMA starts to flatten or turn upwards.
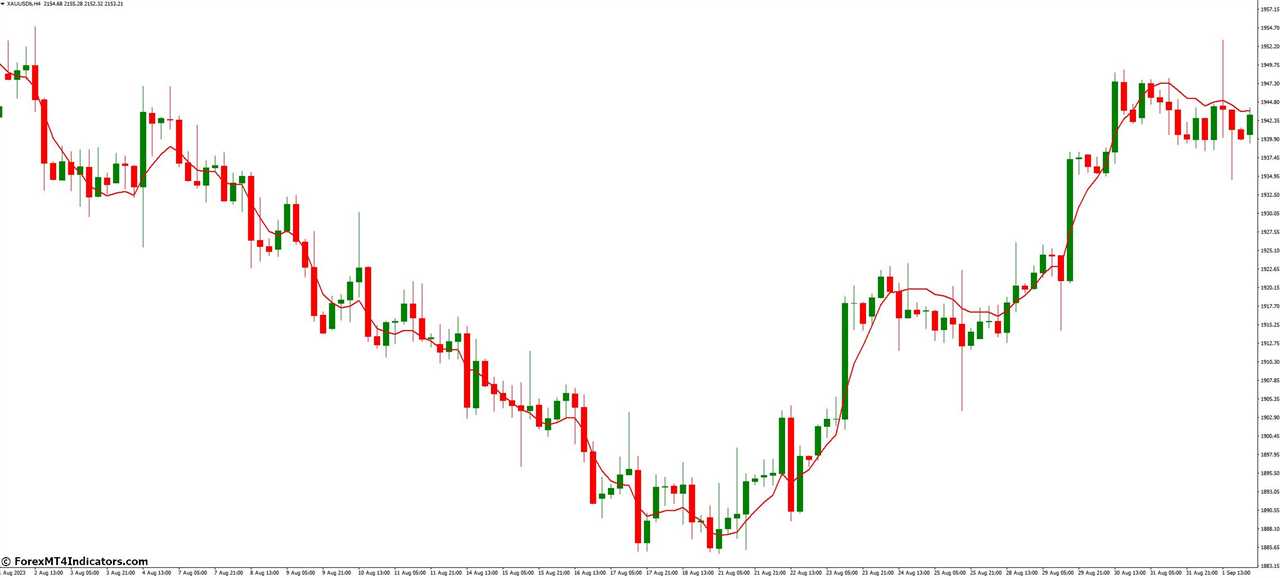
DEMA Indicator Settings

Conclusion
DEMA indicator has emerged as a valuable tool for traders seeking a more responsive and streamlined approach to technical analysis. By understanding its core principles, interpreting its signals effectively, and integrating it strategically within your trading framework, you can potentially gain an edge in navigating the ever-evolving market landscape.
Recommended MT4/MT5 Brokers
XM Broker
- Free $50 To Start Trading Instantly! (Withdraw-able Profit)
- Deposit Bonus up to $5,000
- Unlimited Loyalty Program
- Award Winning Forex Broker
- Additional Exclusive Bonuses Throughout The Year

>> Sign Up for XM Broker Account here <<
FBS Broker
- Trade 100 Bonus: Free $100 to kickstart your trading journey!
- 100% Deposit Bonus: Double your deposit up to $10,000 and trade with enhanced capital.
- Leverage up to 1:3000: Maximizing potential profits with one of the highest leverage options available.
- ‘Best Customer Service Broker Asia’ Award: Recognized excellence in customer support and service.
- Seasonal Promotions: Enjoy a variety of exclusive bonuses and promotional offers all year round.

>> Sign Up for FBS Broker Account here <<

(Free MT4 Indicators Download)
Click here below to download:
DEMA MT4 Indicator
.png) InvestingStocksToolsClubsVideosPrivacy PolicyTerms And Conditions
InvestingStocksToolsClubsVideosPrivacy PolicyTerms And Conditions
