||
Today we will look at the medium-term Support and Resistance Based on the 240 Bars strategy. Support and resistance levels will be automatically plotted using the SF Trend Lines indicator as "bullish" and "bearish" channels. The strategy involves trading the pairs EUR/USD, GBP/USD, USD/JPY, USD/CAD, USD/CHF, and NZD/USD on the four-hour chart.
In this article we will explain how to add the indicator to the trading terminal, discuss the rules for opening and closing positions, as well as the subtleties of setting Stop Loss and Take Profit.
Support and Resistance Strategy Indicators Based on 240 Bars.Setting up the SF Trend Lines indicator
- Download SF Trend Lines
- Add it to the installed trading terminal by opening the MQL4 folder and pasting it into the Indicators folder
- Add an indicator to the chart in MT4, working from the menu: Insert → Indicators → Custom → sf-trend-lines
- You can change the colour of the trend lines in the settings, but it is important to leave the number of bars at 240 unchanged
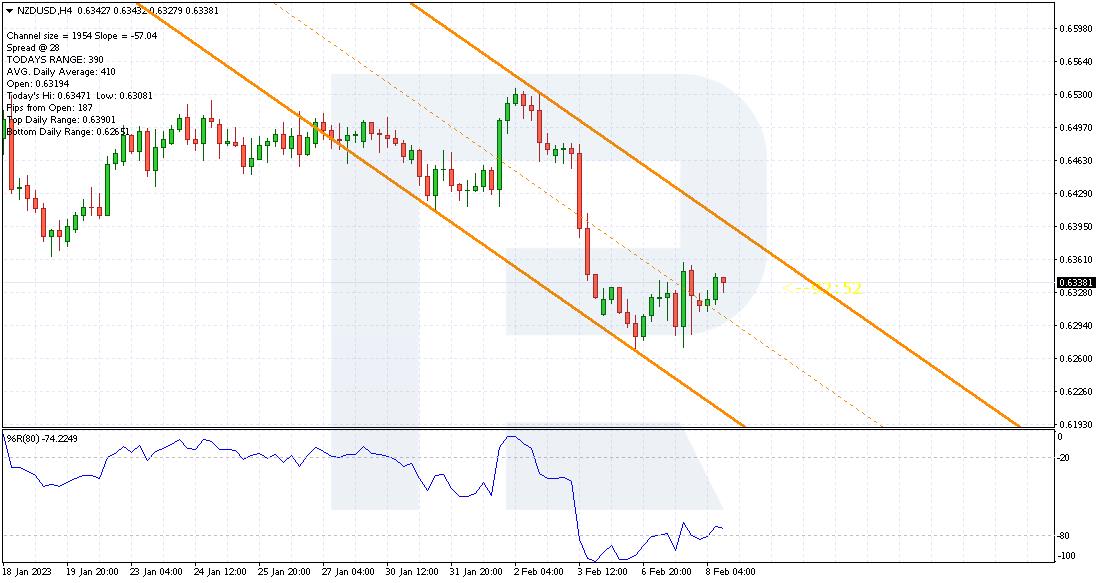
SF Trend Lines builds a price channel with the upper boundary acting as critical resistance, so a pullback is expected from it. The lower boundary of this channel is a critical support area, so an upward bounce is expected from it.
The indicator does not build the entire chart with channels; it builds only the actual channel, which means you cannot assess the quality of signals on the history of the chart - only in real time. There can only be one channel on the H4 chart.
How to Buy with Support and Resistance Based on 240 Bars
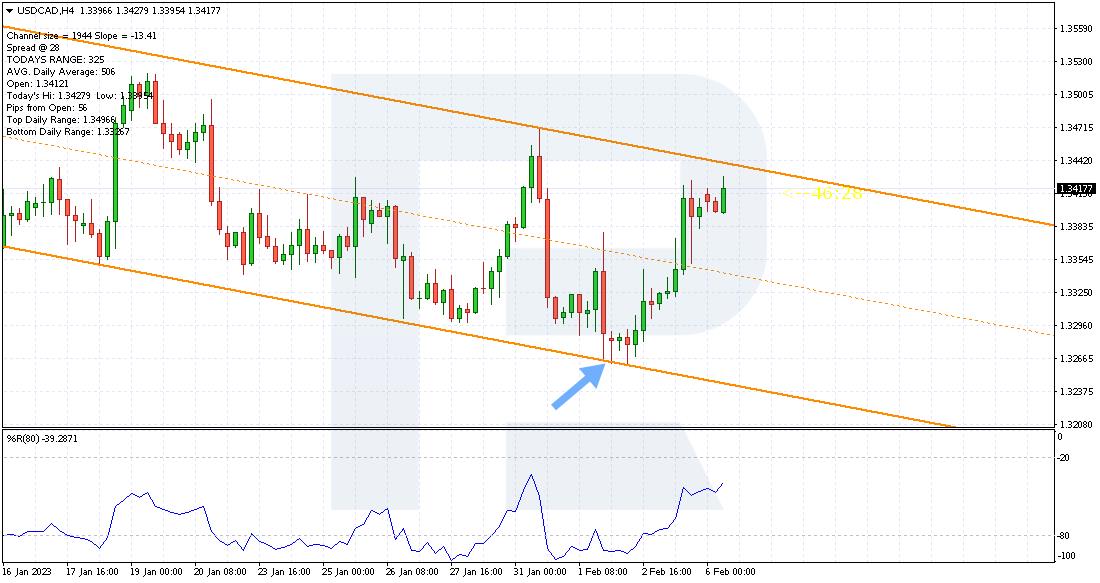
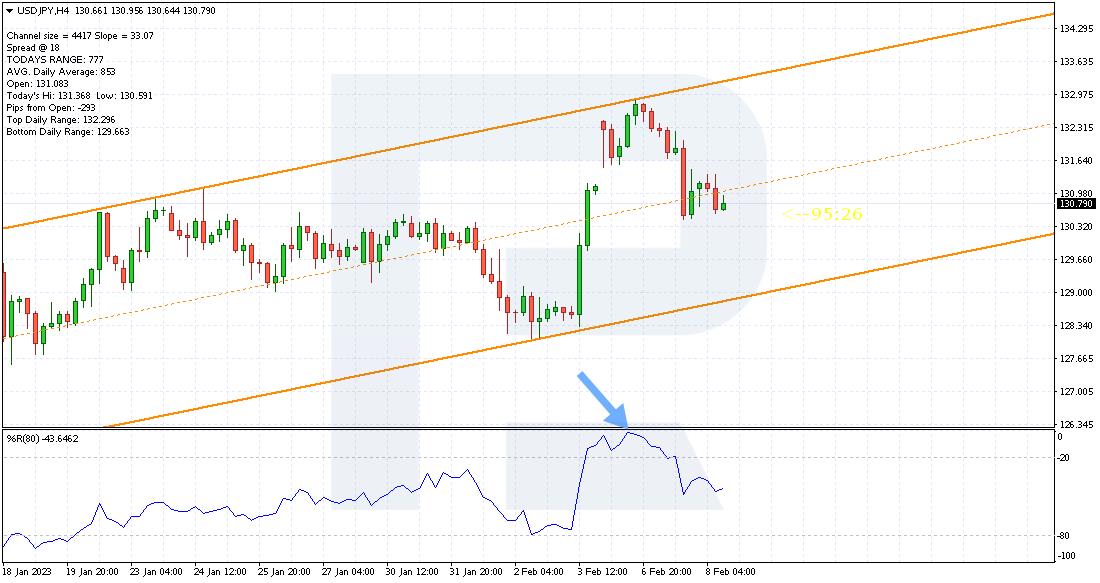
1. The price should reach the bottom of the uptrend channel on the SF Trend Lines indicator chart.
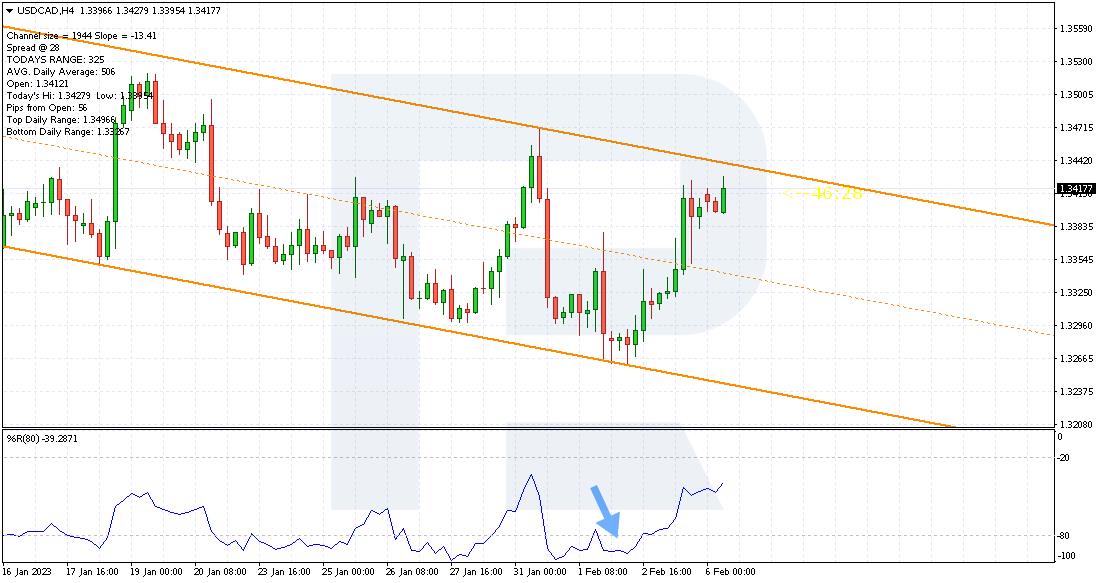
The first signal to buy2. The Williams' Percent Range (Williams' %R) indicator can be used as a confirmation signal. Its values should fall below the -80 level.
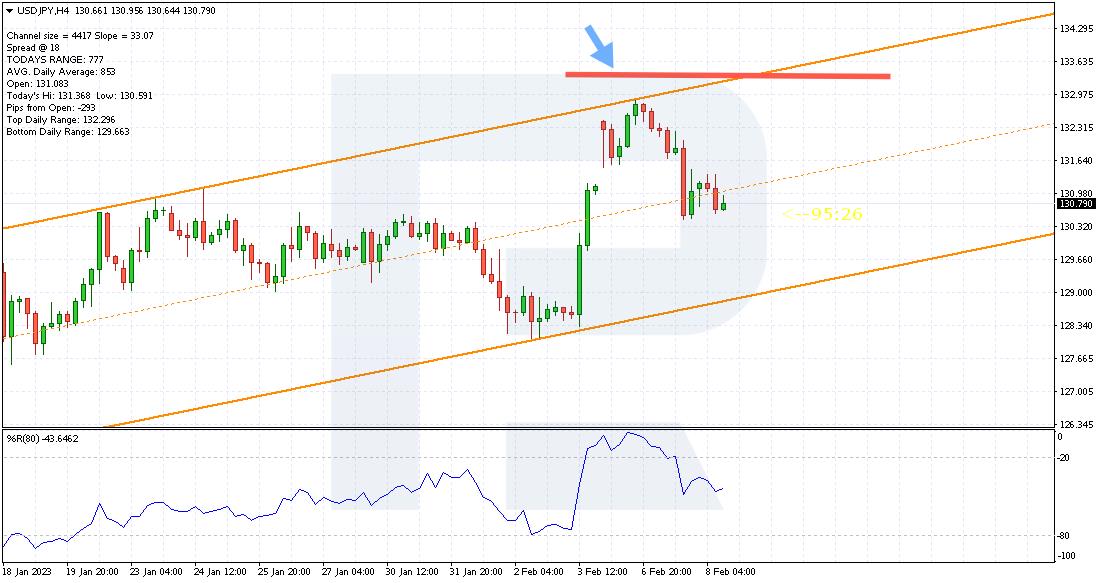
Second buy signal3. Stop Loss can be set behind the lower boundary line of the SF Trend Lines channel. If the price has already fallen below this line and rebounded, then the Stop Loss should be set 5-10 points below the candlestick's low.
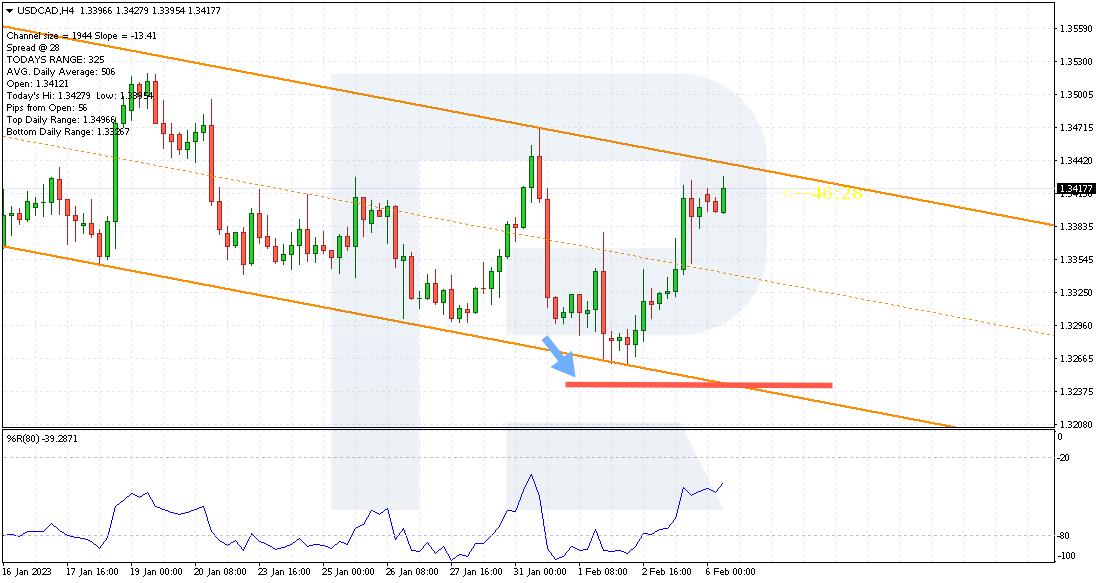
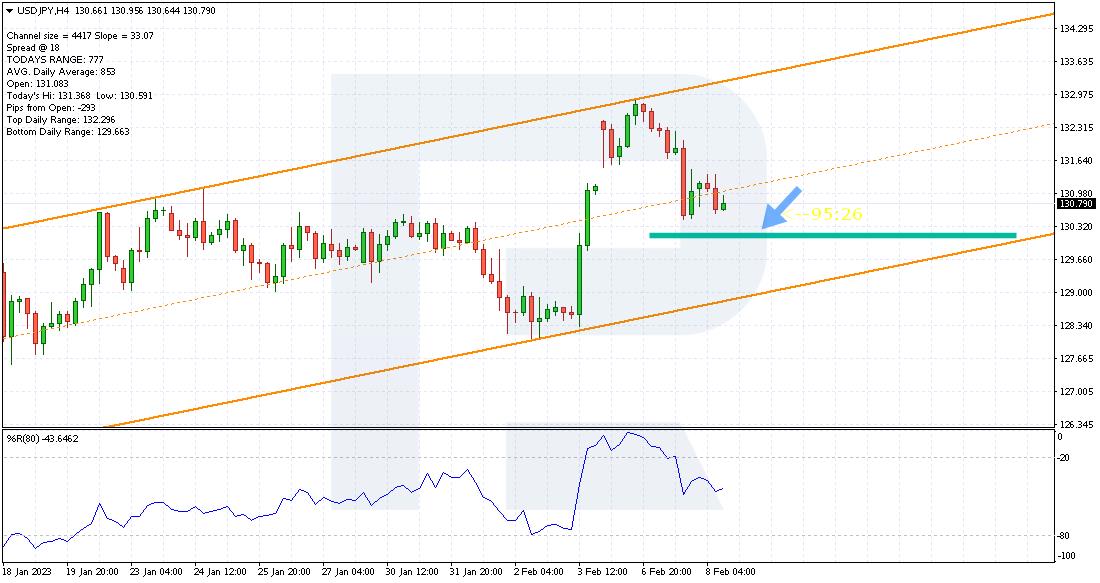
Strategy Stop Loss4. Take Profit is based on a 1:4 profit/loss ratio. If Stop Loss is 30 points, Take Profit is 120.
Take Profit StrategySupport and Resistance Based on the 240 Bars Buying Example
- On the chart of the currency pair EUR/USD on 6 February 2023, after rebounding from the upper boundary of the "bullish" channel where there was a strong resistance level, the price fell and tested the support line of the indicator SF Trend Lines
- The Williams' %R indicator was below -80, indicating that the currency pair was severely oversold
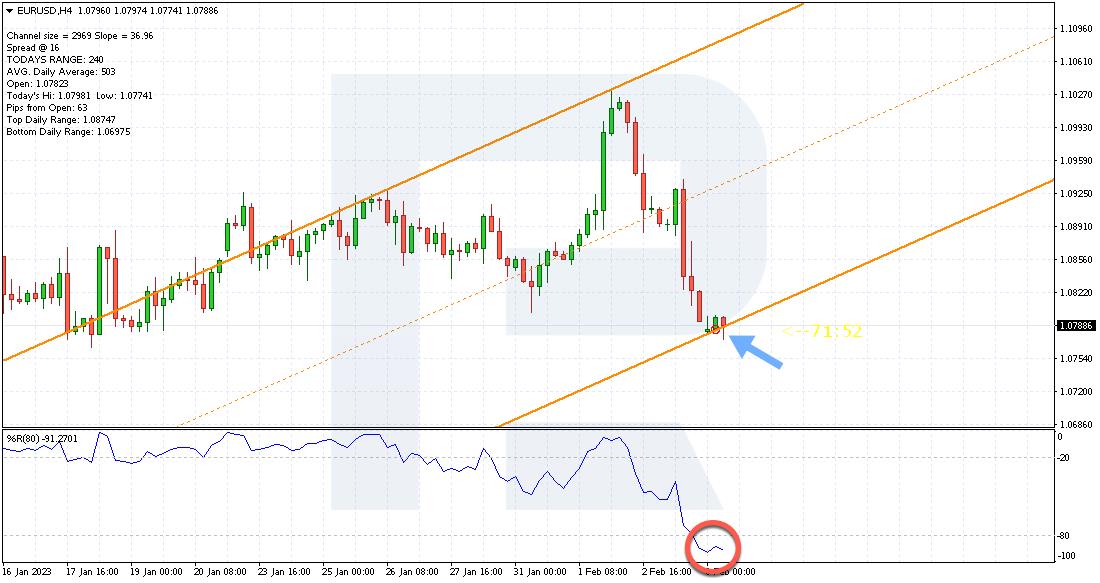
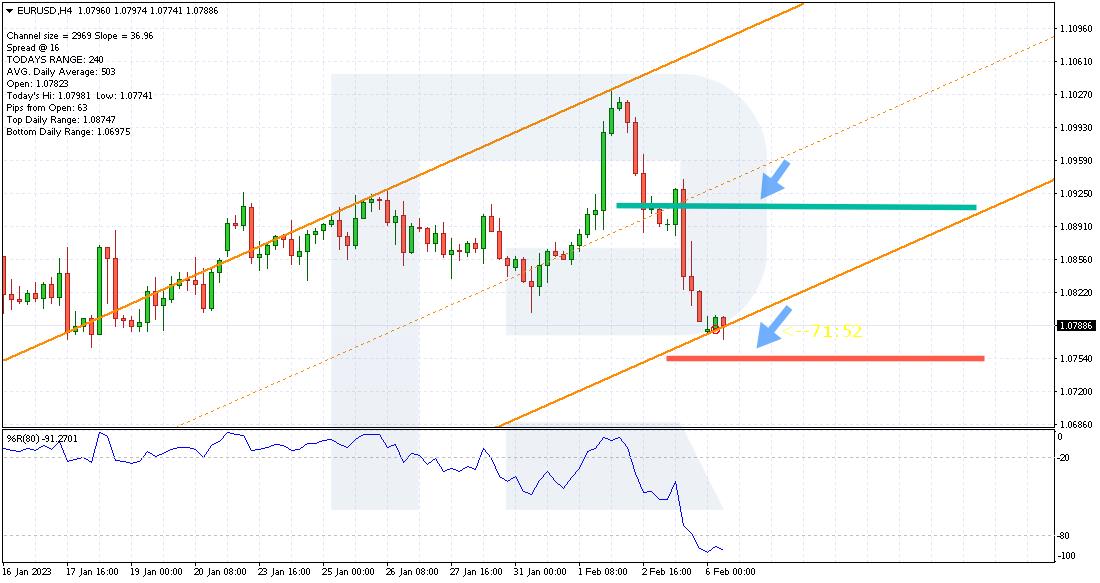
An example of buying by strategy- A long position was opened at 1.0786
- The stop loss was placed below the support line, at 1.0756. Its size is 30 points
- Take Profit was set at 1.0906 Its size is four times the size of the Stop Loss
Example of a Stop Loss and Take Profit strategyHow to Sell by Support and Resistance Based on 240 Bars
1. The price should reach the upper limit of the descending channel on the SF Trend Lines indicator chart.
First Sell Signal2. The Williams' Percent Range (Williams' %R) indicator should rise above the -20 level.
Second sell signal3. Stop Loss can be set behind the upper limit line of the SF Trend Lines channel. If the price has already risen above this line and returned, then the Stop Loss should be set 5-10 points above the candlestick's maximum.
Strategy Stop Loss4. Take Profit is based on a 1:4 profit/loss ratio. If Stop Loss is 20 points, Take Profit is 80 points.
Take Profit StrategyExample of a Support and Resistance Based on 240 Bars strategy
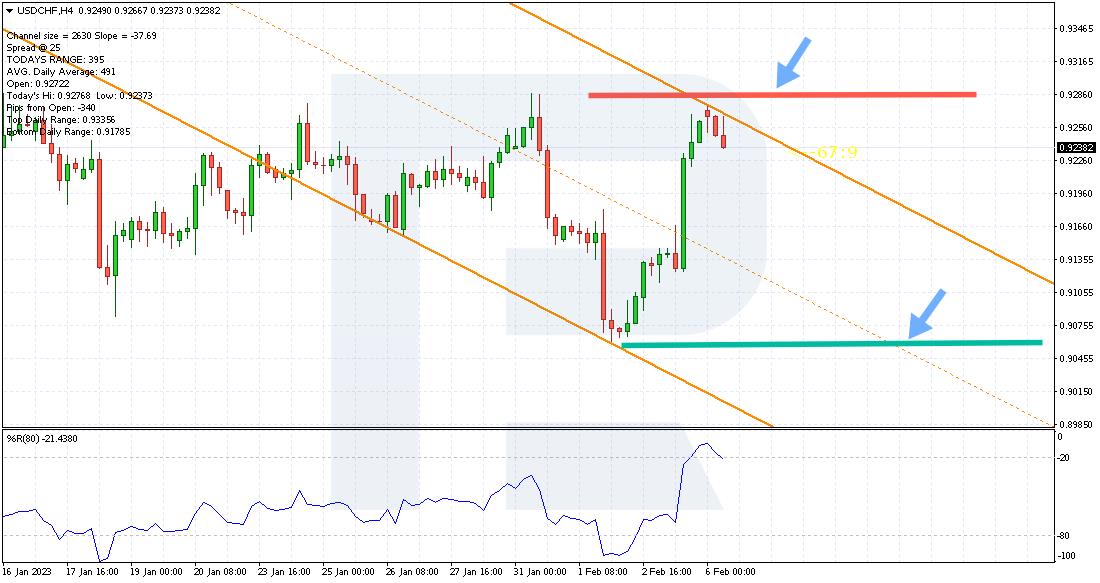
- On the USD/CHF currency pair chart from 6 February 2023, the price has already been pushed away from the upper boundary of the descending channel
- The Williams' %R indicator was above the -20 level, indicating that the currency pair was heavily overbought
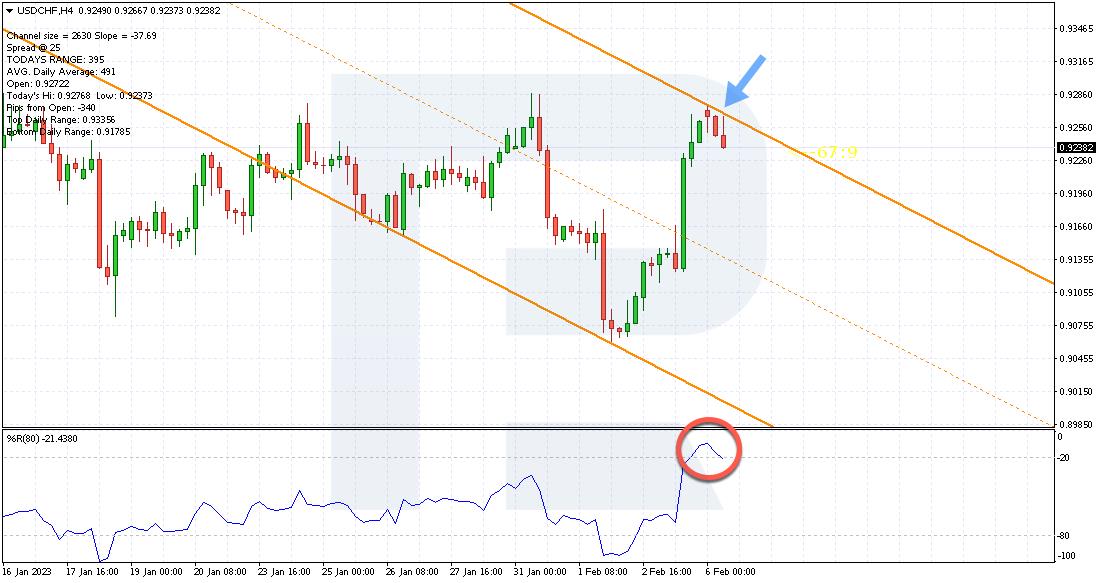
Example of a Support and Resistance Based on 240 Bars strategy- A short position was opened at 0.9237
- The stop loss was set above the upper boundary of the descending channel, at 0.9280. Its size is 43 points
- Take Profit was set at 0.9065. Its size is four times the size of the Stop Loss
Example of a Stop Loss and Take Profit strategyConclusion
The Support and Resistance Based on the 240 Bars trading strategy is a medium-term variant that works according to simple rules. To find the entry point, you need to download and install the indicator SF Trend Lines, which will draw the upward and downward channels. The boundaries of these channels are the critical support and resistance levels from which you must work for a bounce. The Williams' %R indicator is used as an auxiliary signal.
The first advantage of the strategy is that there is no subjective factor. Traders do not study the chart themselves, but observe the construction of the indicator and make a decision. The second advantage is risk management: the profit should exceed the loss by a factor of 4.
A significant disadvantage of the strategy is the impossibility to test the data on history: the SF Trend Lines indicator redraws channels, which means only one channel will always be relevant.
The post Setting Up the "Support and Resistance Based on 240 Bars" Trading Strategy appeared first at R Blog - RoboForex.
||
-----------------------------------------------------
By: Andrey Goilov
Title: Setting Up the "Support and Resistance Based on 240 Bars" Trading Strategy
Sourced From: blog.roboforex.com/blog/2023/02/10/setting-up-the-support-and-resistance-based-on-240-bars-trading-strategy/
Published Date: Fri, 10 Feb 2023 11:40:35 +0000
Read More
Did you miss our previous article...
https://peaceofmindinvesting.com/tools/macd-histogram-multitimeframe-multi-color-indicator-for-mt5
.png) InvestingStocksToolsClubsVideosPrivacy PolicyTerms And Conditions
InvestingStocksToolsClubsVideosPrivacy PolicyTerms And Conditions
