||
Are you tired of not making money in the forex market? Many traders struggle every day. The market’s ups and downs can confuse even the most skilled traders.
But what if you could find the market’s turning points easily? This could change everything.
Meet the Shved Supply & Demand and Order Block Breaker forex trading. It uses supply and demand and order block analysis. This gives traders a big advantage in the market.
By focusing on these key areas, you can make better trades. This can greatly increase your chances of winning.
Key Takeaways
- Combines supply and demand with order block analysis
- Identifies key market turning points
- Improves trade entry precision
- Suitable for novice and experienced traders
- Helps cut through market noise
- Boosts overall trading success rates
Understanding Supply and Demand in Forex Markets
Forex markets work on supply and demand. These forces shape prices and open trading chances. Let’s explore the main points of supply and demand in forex trading.
Basic Principles of Market Forces
Supply and demand control currency prices. High demand means prices go up. Low demand means prices drop. This balance creates areas where prices often move, helping traders.
Key Price Action Patterns
Price patterns show where supply and demand might be. Inside bars are a key pattern. They look like small candles inside bigger ones on charts.
- Inside bars are more reliable on daily charts
- They can form multiple times within a single-mother bar
- Traders use inside bars for breakout or reversal plays
Psychology Behind Supply and Demand Zones
Trading psychology is key in supply and demand zones. These spots often have big orders from market players. As prices hit these zones, traders look for changes based on past moves.
| Aspect |
Impact on Trading |
| Market Forces |
Drive price movements and create trading opportunities |
| Price Action Patterns |
Help identify where supply and demand might be |
| Trading Psychology |
Influences trader behavior at key price levels |
Introduction to Order Block Trading
Order block trading is key in forex market analysis. It helps find important spots where big orders change prices. This way, traders can see where prices might stop or start moving.
What Are Order Blocks?
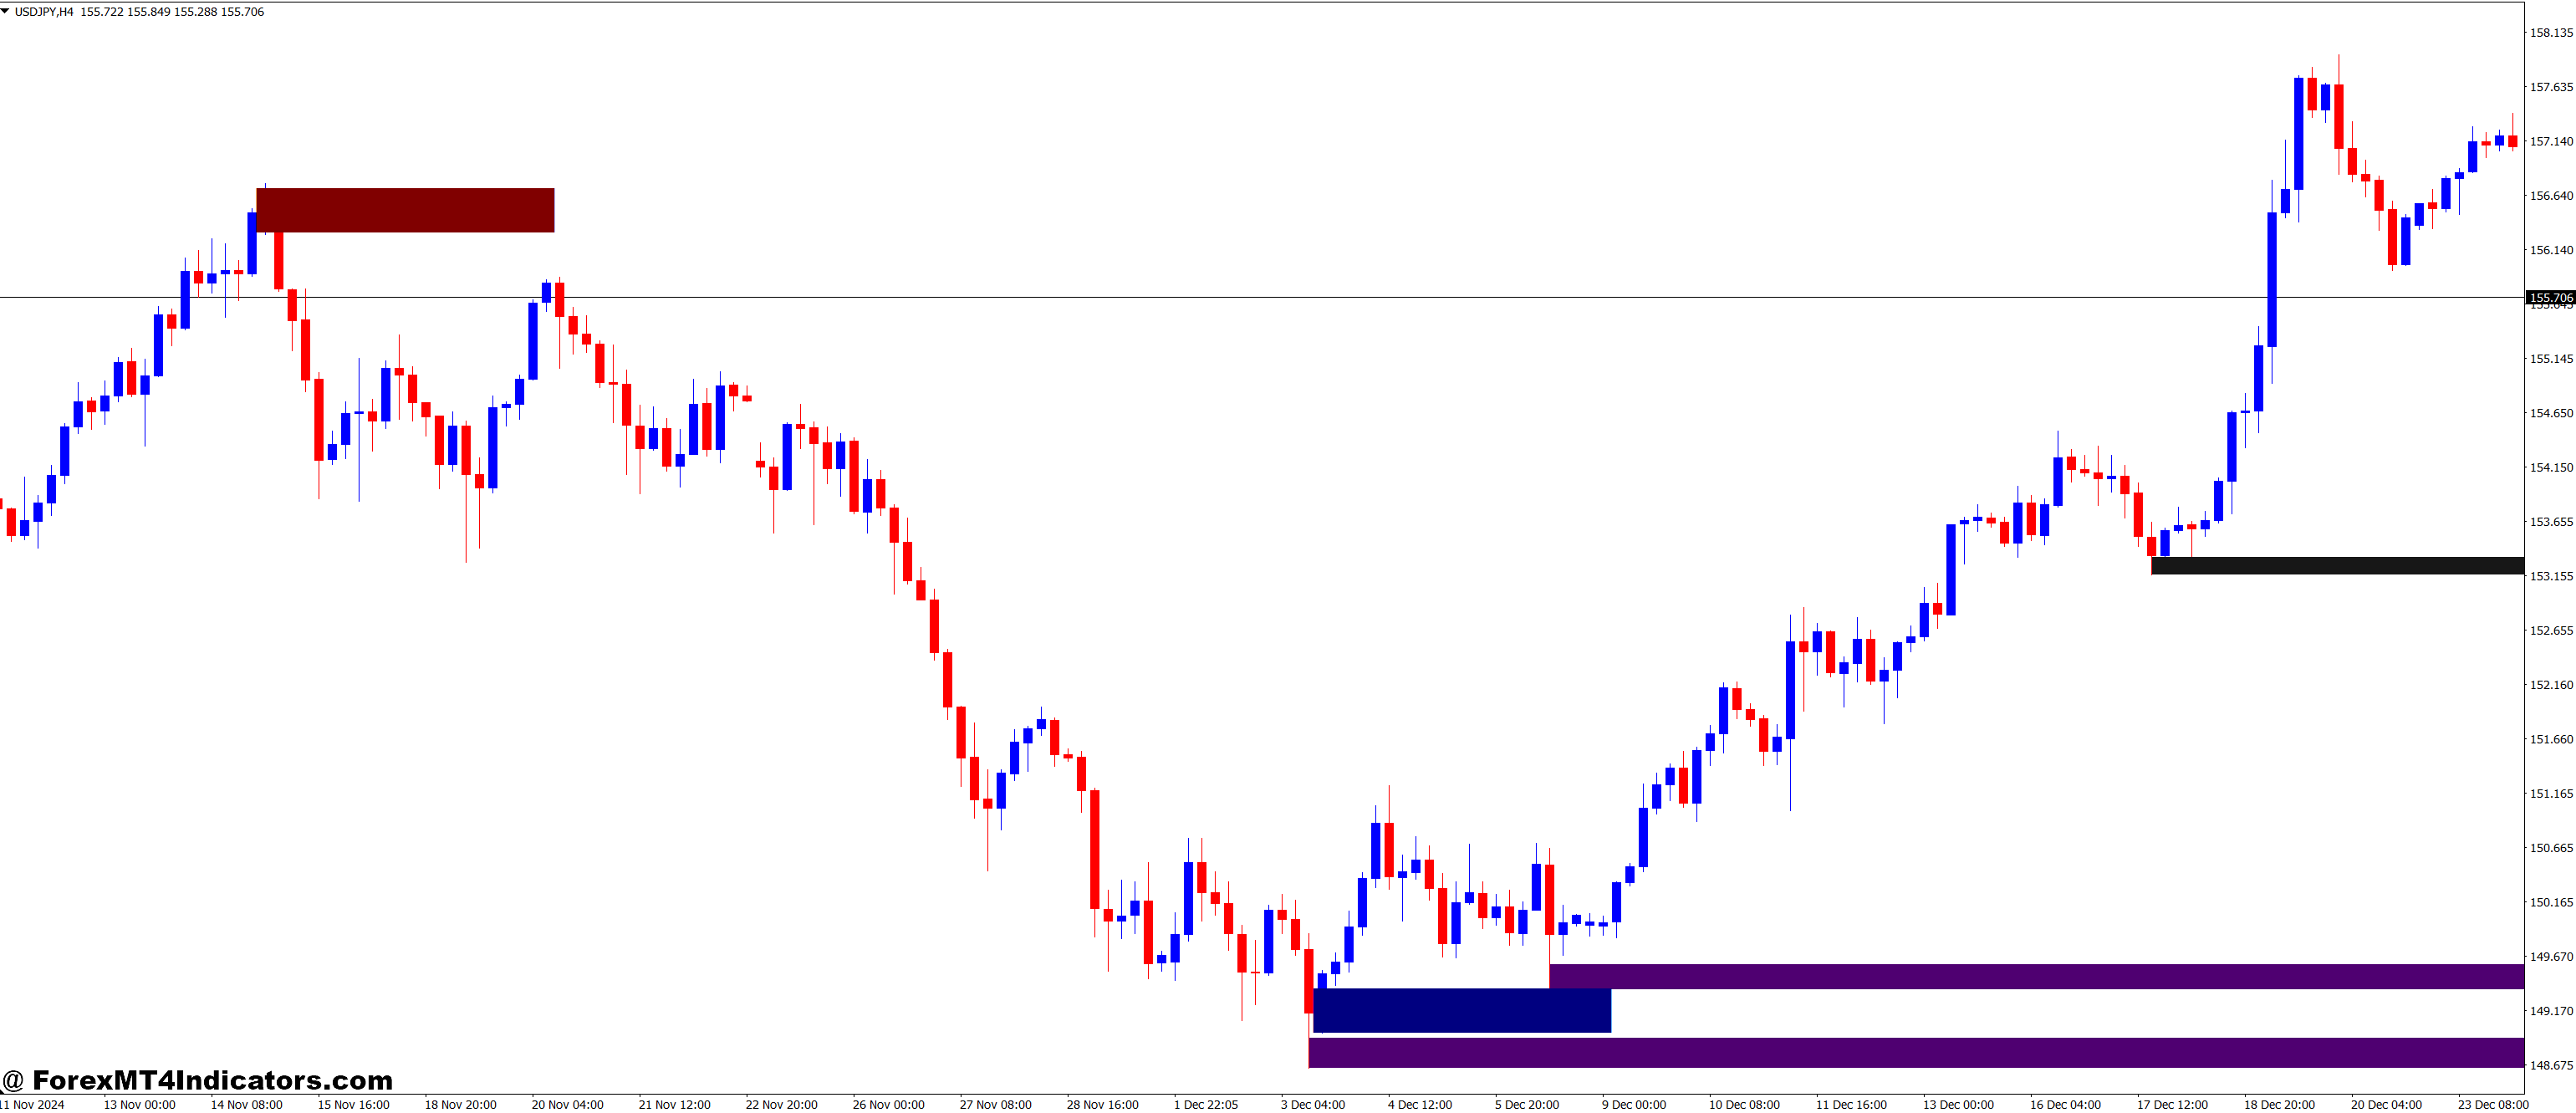
Order blocks are spots on charts where lots of buying or selling happens. These spots are very important in market structure. They can change how prices move later. The Order Block Breaker Indicator shows these important areas.
Types of Order Blocks
There are different kinds of order blocks:
- Bullish Order Blocks: Places of strong buying
- Bearish Order Blocks: Areas of strong selling
- Mitigation Blocks: Places where prices balance out
Identifying Valid Order Blocks
Finding real order blocks needs a close look at price and volume. Traders use tools like VWAP and OFV to check these areas. The Shved Supply Demand Indicator also marks these busy trading spots.
| Indicator |
Function |
User Base |
| Order Block Breaker |
Identifies zones of significant market influence |
45,000+ users |
| Shved Supply Demand |
Charts of supply and demand areas |
Part of 200+ available indicators |
| FXSSI.OrderBook |
Provides insights into supply and demand levels |
Included in lifetime software license |
The Power of Shved Supply & Demand and Order Block Breaker Forex Trading Strategy

The Shved Supply & Demand and Order Block Breaker strategy is a strong tool for forex trading. It mixes price action analysis with order flow, giving traders a big advantage. By finding key supply and demand zones and order blocks, traders get a better understanding of the market.
Price Action Awesome Indicator signals, like inside bars and pin bars, are key in this strategy. They help spot when the market might change direction. This makes it easier to decide when to enter or leave the market.
Order block detection shows support and resistance zones through price action. This, along with focusing on liquidity grabs and breakout areas, gives traders a clear view of the market. Adding Fair Value Gaps (FVG) makes predictions even better.
This strategy works well because it uses different timeframes and chart methods. Traders can adjust to different market types, from stable to moving markets. By mixing technical indicators with price action, it offers a full view of forex trading.
Technical Components of the Strategy

The Shved Supply & Demand and Order Block Breaker Forex trading strategy uses many technical parts. These parts help traders see the market well and find good trading chances. Let’s look at the main parts of this strategy.
Indicator Settings and Configuration
The strategy uses certain indicators to find supply and demand areas. The Non-Repainting Support and Resistance indicator shows important levels on the chart. It’s important to set this indicator right for the best results. Traders often use 14-21 candles and adjust the sensitivity with market changes.
Timeframe Selection
Choosing the right chart timeframes is key for good technical analysis. The Shved Supply & Demand strategy works on many timeframes. But, many traders like these:
- H4 (4-hour) for trend identification
- H1 (1-hour) for entry confirmation
- M15 (15-minute) for fine-tuning entries
Chart Analysis Methods
Traders use different chart analysis techniques to make better decisions. These include:
- Identifying key support and resistance levels
- Spotting price action patterns like pin bars and engulfing candles
- Analyzing order block formations and breaker zones
By using these technical parts, traders can understand market dynamics better. The goal is to keep practicing and adjust your approach to fit your trading style.
| Component |
Purpose |
Typical Settings |
| Non-Repainting Support and Resistance |
Identify key levels |
Lookback: 14-21 candles |
| Dynamic Supply and Demand Zones |
Highlight possible reversal areas |
Sensitivity: 3-5 |
| Order Block and Breaker Block |
Spot significant price action zones |
Block size: 10-20 pips |
Entry and Exit Rules
The Shved Supply & Demand and Order Block Breaker strategy has clear rules for entering and exiting trades. For the best results, trade on timeframes of 15 minutes or more. This applies to all currency pairs, indices, and commodities.
Trade entry happens when price action matches supply and demand zones. The Non-Repainting Support and Resistance indicator helps find these zones. The Dynamic Supply and Demand Zones indicator shows green for bullish and red for bearish areas.
For exiting trades, aim to take profits at the middle line of the regression channel. Or, target the next support/resistance levels. Use a profit-to-stop loss ratio of 1:1.13 for managing risk. Set the initial stop loss below or above the last swing low or high.
| Time Frame |
Regression Curve Periods |
Deviation |
| 15 min |
185 |
2.0 |
| 30 min |
170 |
2.0 |
| 60 min |
165 |
2.0 |
| 4H |
150 |
2.0 |
| Daily |
140 |
2.0 |
Inside bars, a two-bar pattern can be good for entering trades with tight stops. Place buy or sell stops at the high or low of the mother bar for breakout chances. Sticking to these rules is essential for trading success.
Risk Management Guidelines
Effective risk management is key for successful forex trading. The Shved Supply & Demand and Order Block Breaker strategy has strong risk control. It protects your capital and aims to increase profits.
Position Sizing
Smart position sizing is vital for managing risk. Start with a small lot size of 0.01 for each currency pair. When you hit four target prices, double your lot size.
If you hit a stop loss, cut your lot size in half. This balances risk and reward.
Stop Loss Placement
Place your stop loss below or above the previous swing high or low. This respects market structure and limits losses. The strategy also has a “Risk-Free” setting.
It moves the stop loss to the entry price plus commission once a profit level is reached.
Take Profit Targets
Set your take profit at the middle line of the regression channel or use support and resistance levels. The strategy aims for a 1:3 risk-reward ratio. This means for every unit of risk, you target three units of profit.
This ensures profitable trades outweigh losses over time.
Remember, the “20 PIPs Challenge” and “16S Program” are key parts of this strategy’s money management. By following these guidelines, you’ll be better at navigating the forex market’s ups and downs.
Advanced Order Block Patterns
Advanced trading patterns are key in the Shved Supply & Demand strategy. They help spot market moves and guide decisions.
Bullish Order Blocks
Bullish signals show up as bullish order blocks. These blocks happen when big buy orders push prices up. They form at downtrend bottoms, hinting at a possible turn.
Traders look for these on 15-minute charts or higher for better signals.
Bearish Order Blocks
Bearish order blocks show big selling pressure. They form at uptrend tops, hinting at a possible drop. Traders use these with other indicators to spot bearish signs.
Mitigation Patterns
Mitigation patterns show how the market handles big orders. They help find where prices might pause or change direction. Knowing these patterns helps set better stop-loss and take-profit levels.
When using these patterns, think about the market’s bigger picture. Aim for a profit ratio of 1:1.13. Place stop losses below or above the last swing high or low. This method manages risk and takes advantage of market moves.
Combining with Other Technical Indicators
Traders can improve their market analysis by using the Shved Supply & Demand and Order Block Breaker strategy with other technical indicators. This mix makes trading decisions stronger in the forex market.
Moving averages show a smooth trend line. They help find support and resistance levels. When these levels match supply and demand zones, it makes the trading signal stronger.
The Relative Strength Index (RSI) checks if prices are too high or too low. It adds more to your analysis.
The Moving Average Convergence Divergence (MACD) indicator is also useful. It signals when momentum changes happen with order block formations. This could mean high-probability trade entries. By using these indicators together, traders get a better market analysis framework.
Using many indicators can give more insights. But, don’t make your strategy too complicated. Start with one or two indicators that work well together. Then, improve your strategy based on your trading results and what you see in the market.
- Moving averages for trend identification
- RSI for overbought/oversold conditions
- MACD for momentum changes
By adding these tools, you’re not just sticking to one strategy. You’re building a strong system that looks at different parts of market behavior. This could lead to more informed and profitable trading choices.
Common Trading Mistakes to Avoid
Trading well is more than just knowing what to do. It’s also about managing risks and understanding the market. Let’s look at some common mistakes that can ruin even the best plans.
Over-leveraging
Using too much leverage is a big mistake. Leverage can make your wins bigger, but it can also make your losses bigger. About 75% of traders who use too much leverage lose all their money. Always use a leverage that fits your risk level and how much money you have.
Ignoring Market Context
Not looking at the big picture is another mistake. The MACD divergence can show when prices might change direction in 60% of cases. Always look at different time frames and think about the economy.
Poor Trade Management
Not managing trades well can lead to big losses. The Average True Range (ATR) can help set stop-loss orders, protecting 75% of trades. Use the right amount of money for each trade and set clear stop-loss and take-profit levels.
| Mistake |
Impact |
Solution |
| Over-leveraging |
75% account wipeout rate |
Use appropriate leverage |
| Ignoring Context |
60% missed reversals |
Multi-timeframe analysis |
| Poor Management |
25% unprotected trades |
Use ATR for stop-loss |
By avoiding these common mistakes and focusing on good risk management and market analysis, traders can do much better in the forex market.
How to Trade with Shved Supply and Demand and Order Block Breaker Forex Trading Strategy
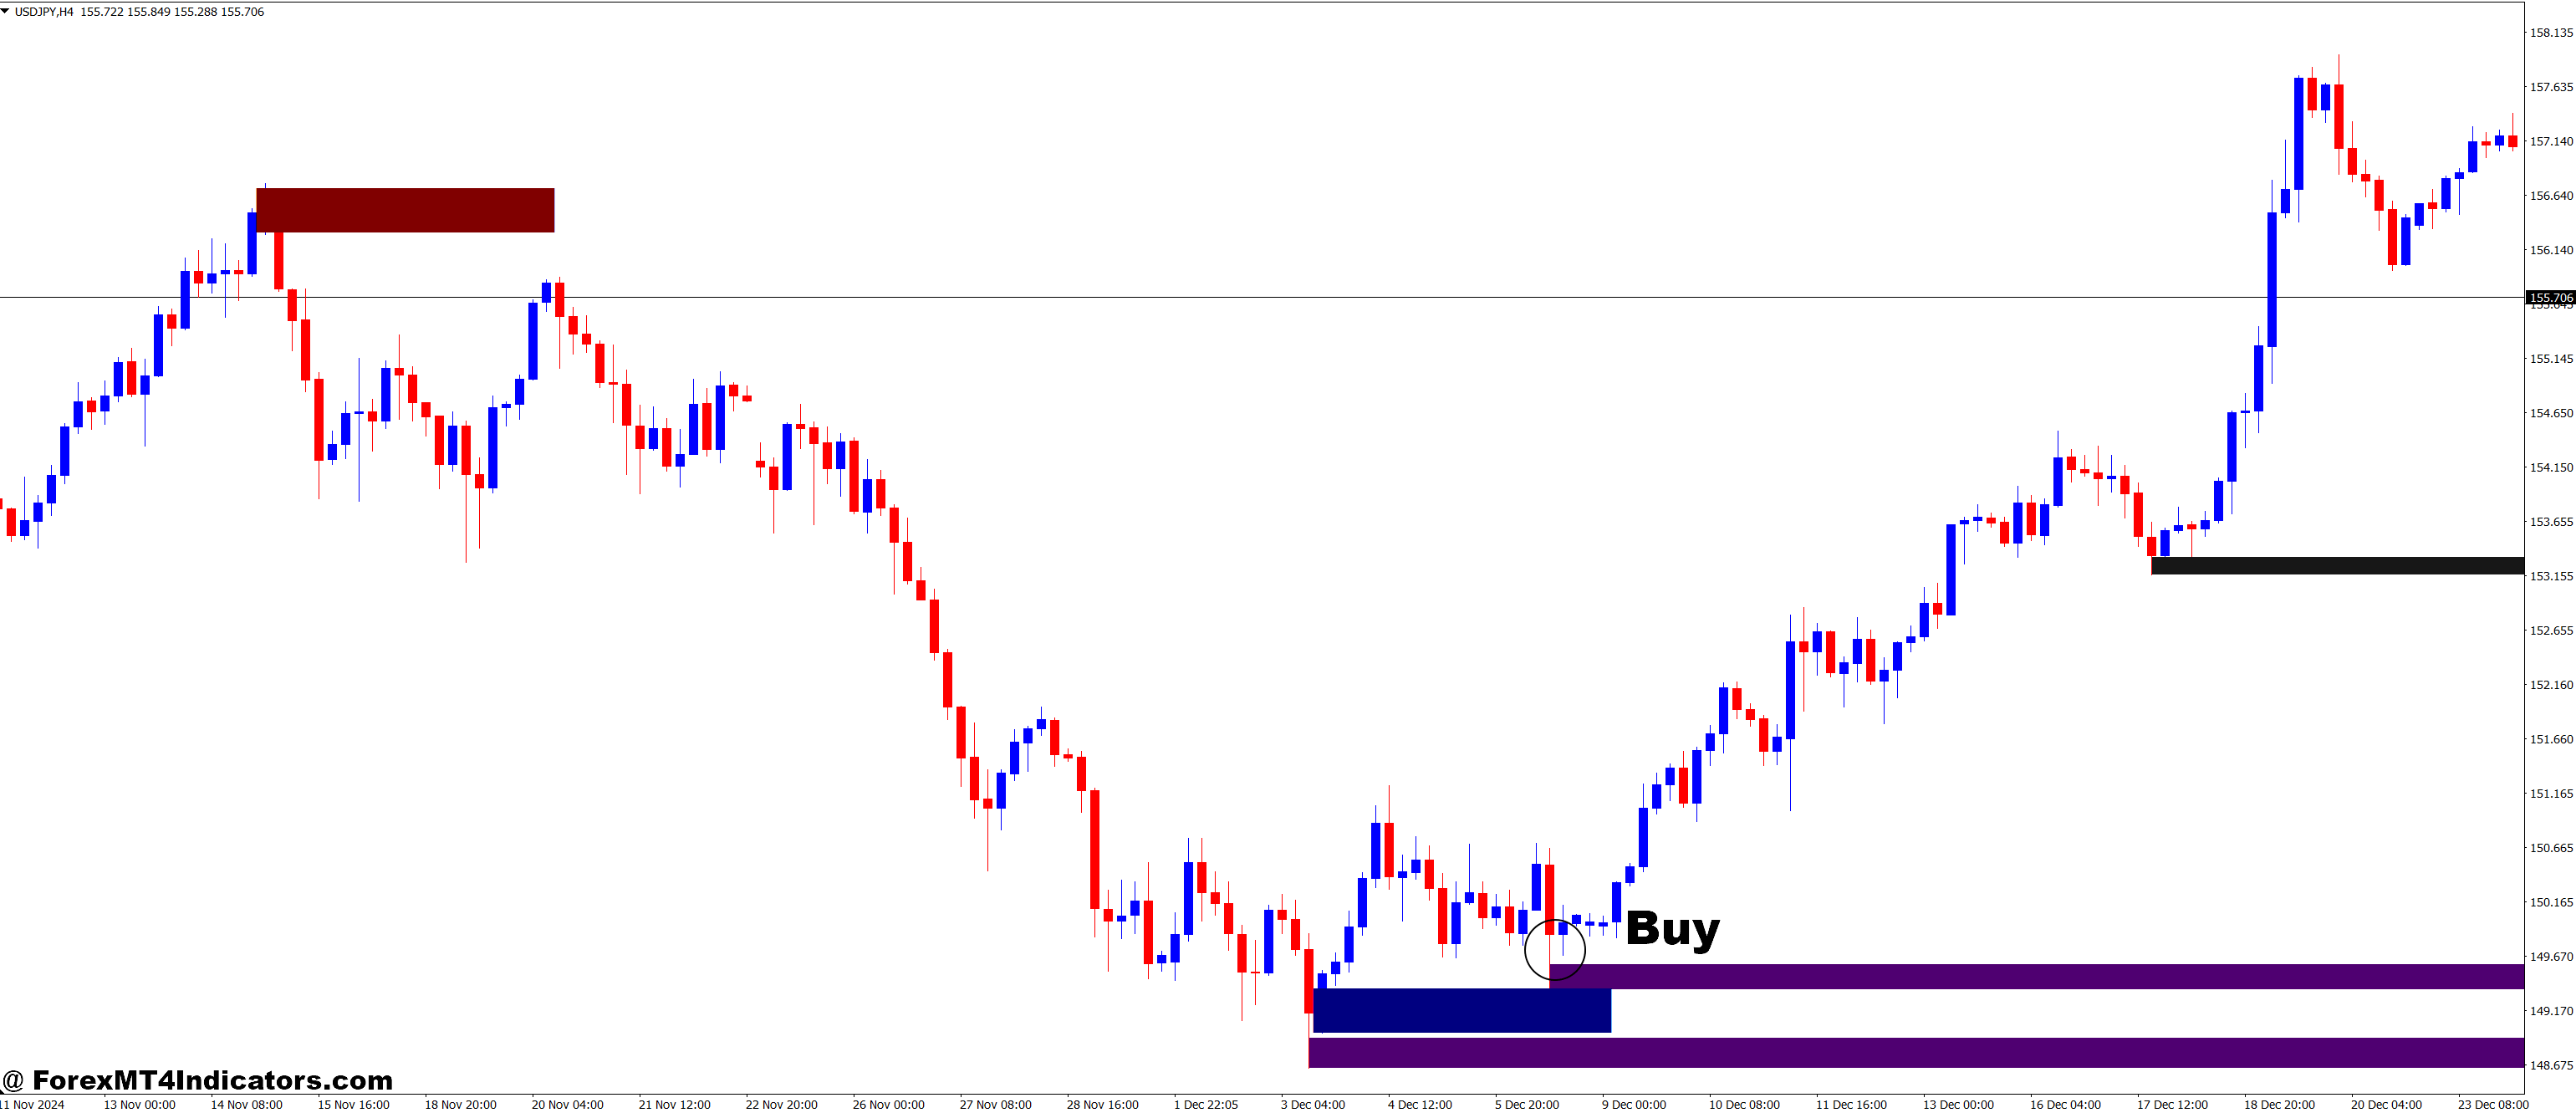
Buy Entry

- Look for a significant bullish order block (a strong price move-up after consolidation or a drop).
- This order block will be the area of interest to watch for price retracement.
- Locate a demand zone where the price has previously bounced up sharply (the area where the price shows signs of buying interest).
- Wait for the price to retrace back to the bullish order block or demand zone.
- Look for price action confirmation like:
- A bullish candlestick pattern (pin bar, engulfing, etc.).
- Price rejection at the demand zone or order block (wick rejections, consolidation).
- Enter long when the price shows clear rejection or consolidation at the bullish order block/demand zone.
- Stop-loss just below the order block or demand zone.
- Take-profit at the next key resistance level or based on your risk-to-reward ratio (e.g., 2:1).
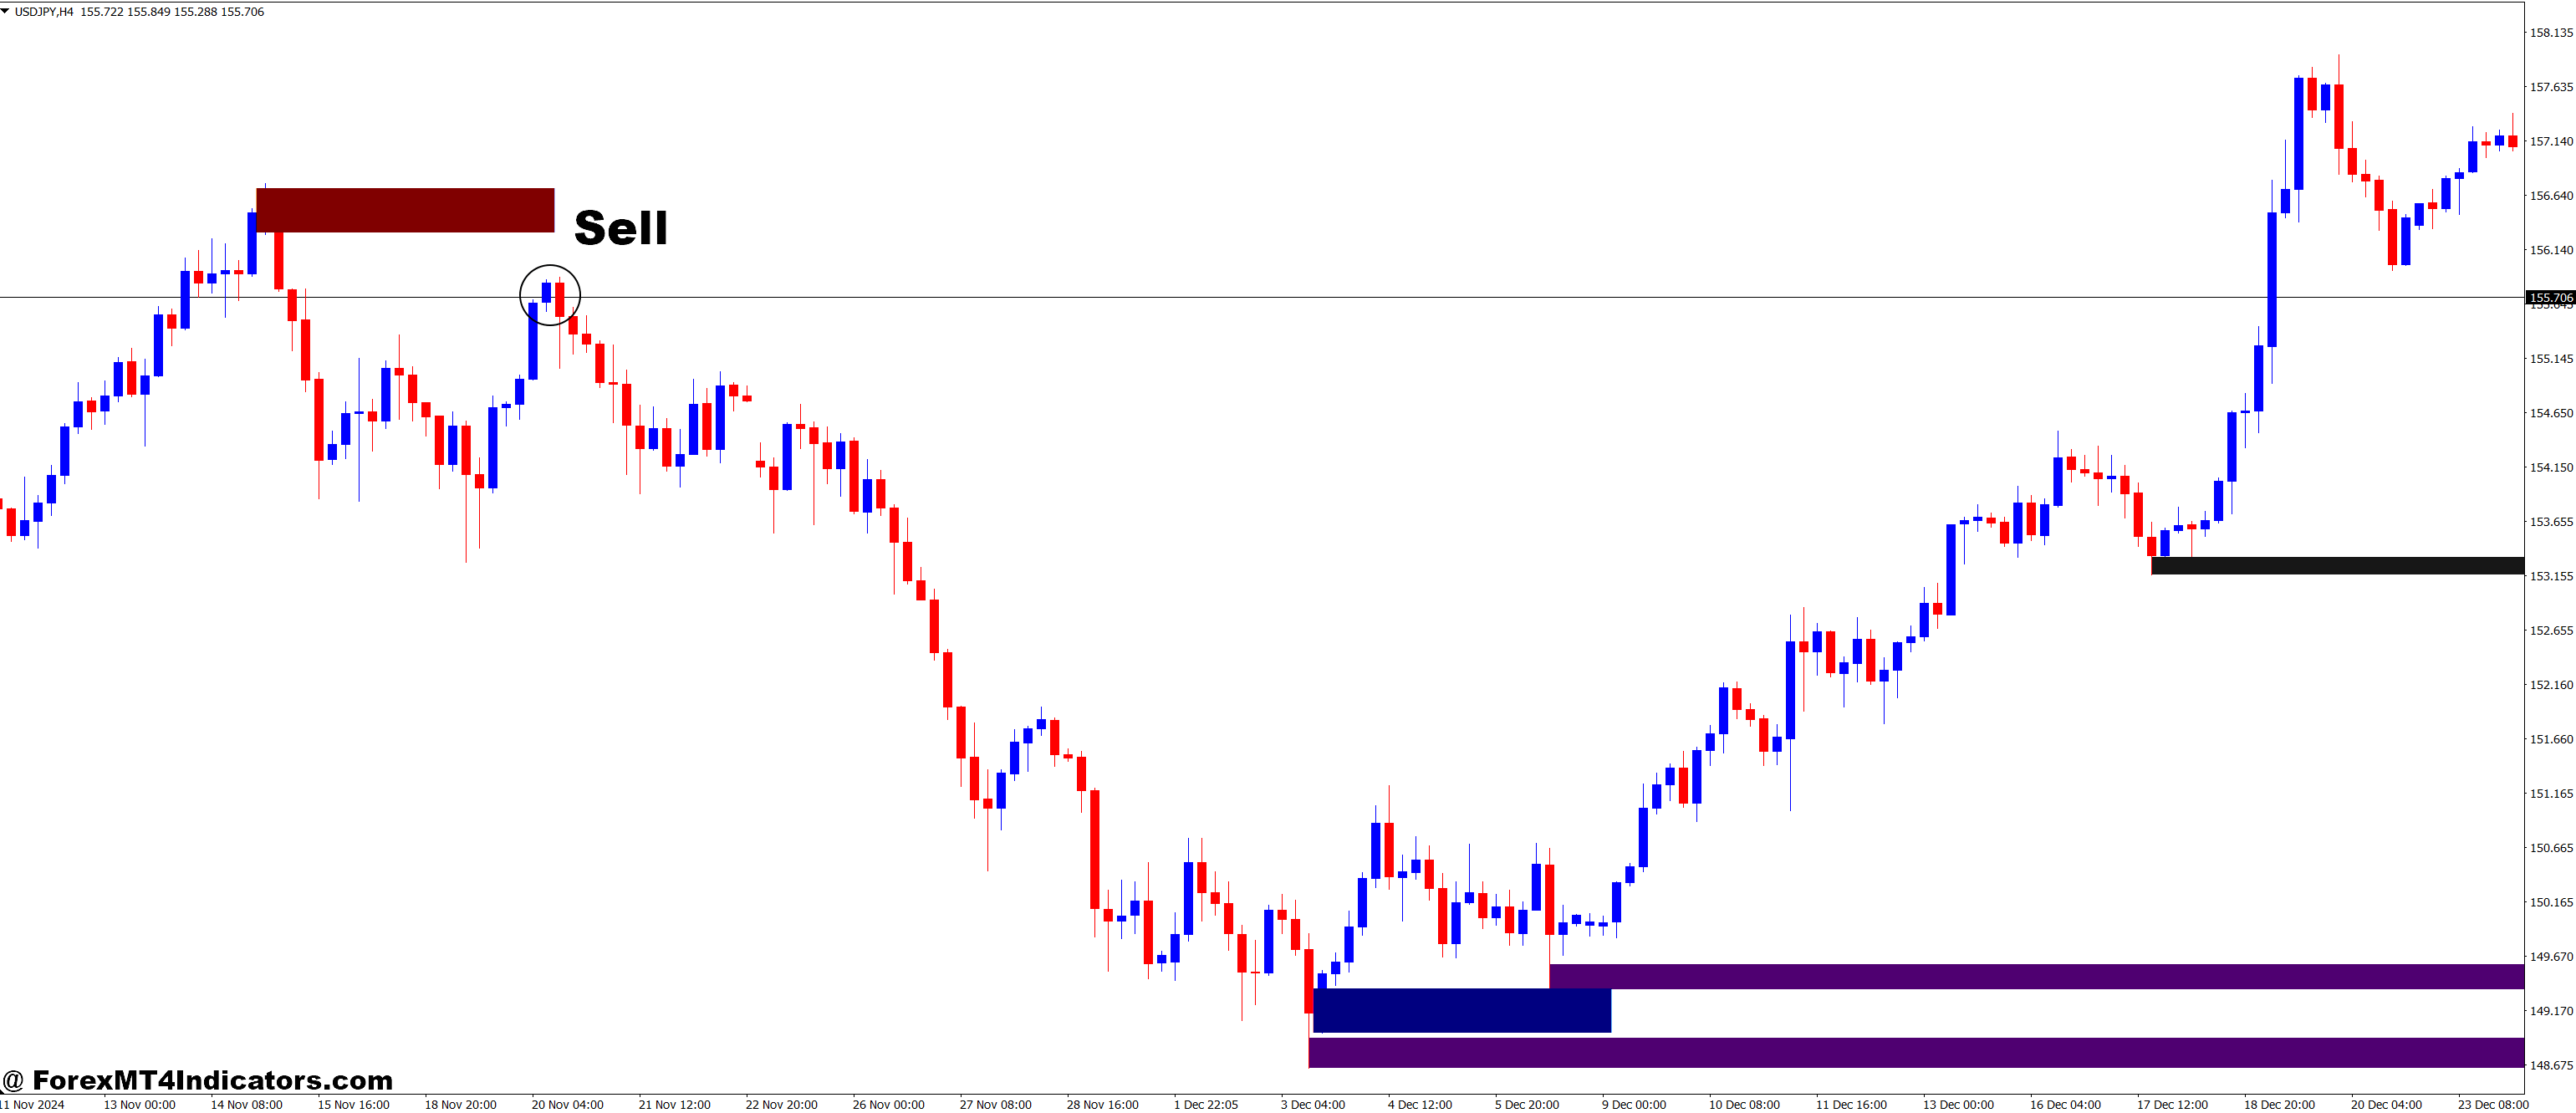
Sell Entry

- Look for a significant bearish order block (strong price move down after consolidation or a rise).
- This order block is the area of interest to wait for a price retracement.
- Locate a supply zone where the price has previously dropped sharply (an area showing signs of selling interest).
- Wait for the price to retrace back to the bearish order block or supply zone.
- Look for price action confirmation like:
- A bearish candlestick pattern (bearish engulfing, shooting star, etc.).
- Price rejection at the supply zone or order block (wick rejections, consolidation).
- Enter short when the price shows clear rejection or consolidation at the bearish order block/supply zone.
- Stop-loss just above the order block or supply zone.
- Take-profit at the next key support level or based on your risk-to-reward ratio (e.g., 2:1).
Conclusion
The Shved Supply & Demand and Order Block Breaker Forex Trading Strategy is powerful. It helps find important market changes. This strategy mixes supply and demand with order block analysis for better trading choices.
Learning never stops for traders. The Order Block Breaker Indicator works with MetaTrader 4. It finds key price areas automatically. This saves time and lets traders work on their strategies.
As traders get better, they might want to try more tools. The Forex Entry Point Indicator and the Trend Path Non-Repaint Indicator are good examples. They can make trading even more accurate. Trading success takes time and effort, but this strategy is a great start.
Recommended MT4 Broker
XM Broker
- Free $50 To Start Trading Instantly! (Withdraw-able Profit)
- Deposit Bonus up to $5,000
- Unlimited Loyalty Program
- Award Winning Forex Broker
- Additional Exclusive Bonuses Throughout The Year
- Exclusive 50% Cash Rebates for all Trades!

>> Sign Up for XM Broker Account here with Exclusive 50% Cash Rebates For All Future Trades [Use This Special Invitation Link] <<
Already an XM client but missing out on cashback? Open New Real Account and Enter this Partner Code: 𝟕𝐖𝟑𝐉𝐐
Click here below to download:
Save
Save
Get Download Access
||
-----------------------------------------------------
By: Tim Morris
Title: Shved Supply and Demand and Order Block Breaker Forex Trading Strategy
Sourced From: forexmt4indicators.com/shved-supply-and-demand-and-order-block-breaker-forex-trading-strategy/?utm_source=rss&utm_medium=rss&utm_campaign=shved-supply-and-demand-and-order-block-breaker-forex-trading-strategy
Published Date: Tue, 25 Feb 2025 07:00:45 +0000
Read More
.png) InvestingStocksToolsClubsVideosPrivacy PolicyTerms And Conditions
InvestingStocksToolsClubsVideosPrivacy PolicyTerms And Conditions
