||
In this article, we will consider the use of harmonic patterns in trading. We will get acquainted with the history of their emergence, and the principles of their formation, and tell you about the most popular patterns.
What are harmonic patterns?
Harmonic patterns are graphical price patterns based on a combination of Fibonacci ratios and Elliott wave elements. The basis for such patterns was laid down in the works of Harold Gartley, a renowned analyst, and technical analysis specialist. His book "Profits in the Stock Market" describes his trading methodology in detail.
The harmonic patterns became widely known and popular at the end of the last century when Gartley's works were further developed by his followers - Scott Carney, Larry Pesavento, and Bryce Gilmore. They have refined the description of already known models, and also identified and described new ones.
Harmonic patterns are versatile: they can be used to trade on different timeframes and financial markets. The most popular are Gartley, Butterfly, 5-0, Crab, ABCD, Bat, and Shark.
Gartley pattern
The Gartley pattern is one of the first harmonic patterns described. It is also called "Gartley's butterfly" because of the similarity in the outlines of price movements, and the Fibonacci lines on the chart resembling the wings of a butterfly.
Stages in the formation of the Gartley pattern:
- XA is the first impulse of the price movement on the chart
- AB is the correction from the first XA movement at approximately 61.8%
- BC can be 38.2%, 50%, 61.8%, 78.6%, 88.6% of the AB wavelength
- CD can be 127.2%, 146%, 150%, and 161.8% of the BC wavelength and ends around the correction level of 78.6% of the XA wavelength
- The D-point is the final point in the pattern, where a reversal of quotes is expected
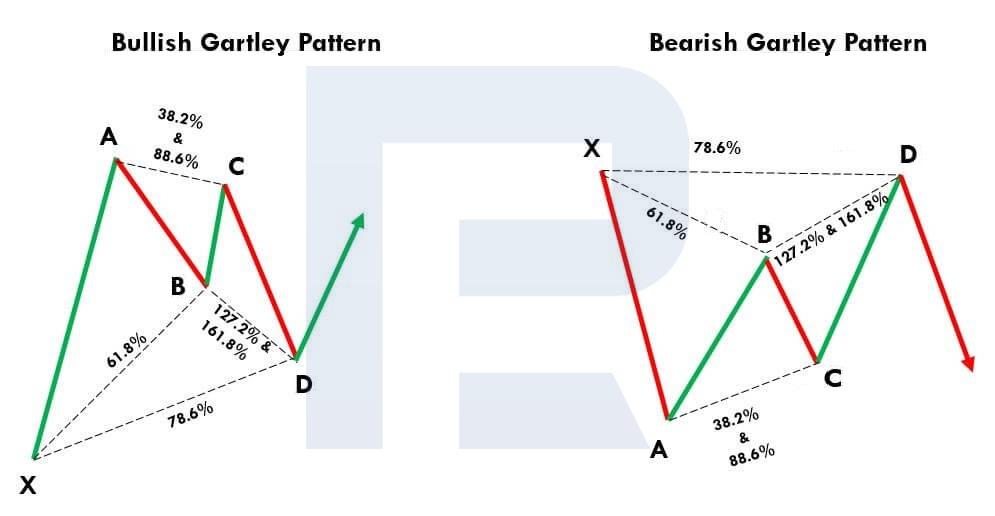
The bullish and bearish Gartley patternButterfly pattern
The Butterfly pattern, created by Bruce Gilmore, is very similar to the one mentioned above. Therefore, understandably, many traders confuse the two.
Stages in the formation of the Butterfly pattern
- XA is the first impulse of the price movement on the chart
- AB is the correction from the first XA movement at approximately 78.6%
- BC can range from 38.2% to 88.6% of the AB wavelength
- CD can range from 161.8% to 224% of the BC wavelength and ends at about 127.2% of the XA wavelength
- The D-point is the final point in the pattern, where a reversal of quotes is expected
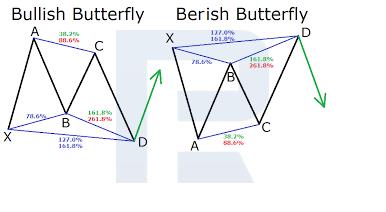
Bull and bear Butterfly pattern5-0 Pattern
The 5-0 pattern was first described in detail in Scott Carney's book "Harmonic Trading: Volume Two", which was published in 2007. Visually, it resembles the Head & Shoulders and Wolf Waves patterns.
Stages in the formation of the 5-0 pattern:
- OX is the first impulse of the price movement on the chart
- XA is the correction from the first OX movement
- AB can range from 113% to 161.8% of the OX wavelength
- BC is the longest wavelength and can be between 161.8% and 224% of the AB wavelength
- CD is the final leg of the pattern and ends at approximately 50% of the BC wavelength and 88.6-113% of the OX wavelength
- The D-point is the final point in the pattern, where a reversal of quotes is expected
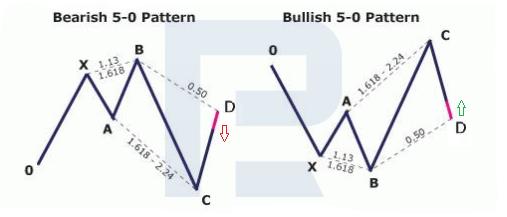
5-0 bull and bear patternCrab pattern
The harmonic Crab pattern was introduced to the trading community by Scott Carney in 2000. Its appearance on the price chart signals the end of the current price momentum and an impending reversal.
Stages in the formation of the Crab pattern:
- XA is the first impulse of the price movement on the chart
- AB is the correction from the first XA movement, ranging from 38.2% to 61.8%
- BC can range from 38.2% to 88.6% of the wavelength of AB
- CD, the longest wave, ends at about 161.8% of the XA wavelength and is an extension of 224-361.8% of the BC wavelength
- The D-point is the final point in the pattern, where a reversal of quotes is expected
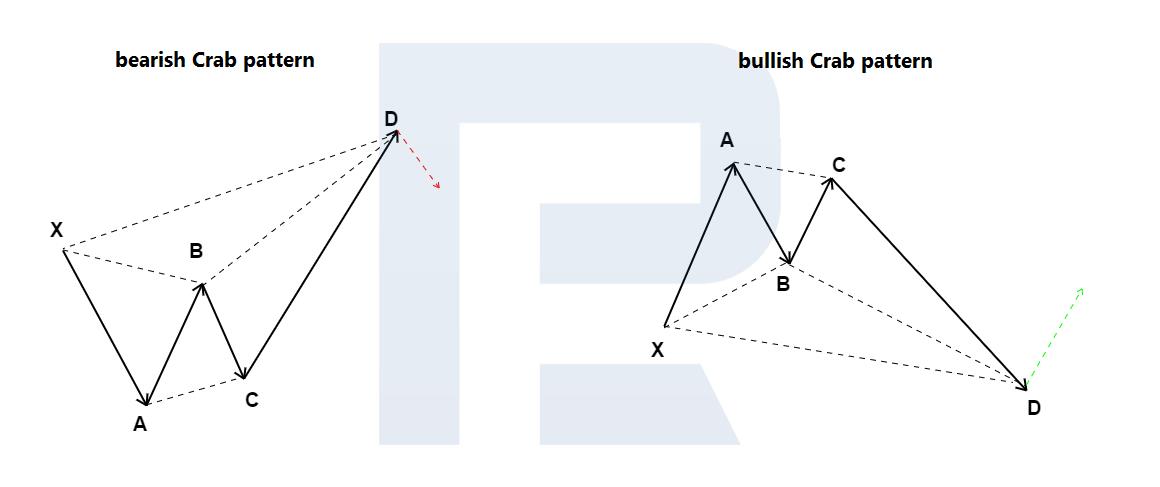
Bullish and bearish Crab patternABCD Pattern
ABCD is one of the most straightforward harmonic patterns and looks like diagonal lightning on a price chart. It is essentially a three-wave correction, after which the price movement towards the main trend can continue.
Stages in the formation of the ABCD pattern:
- AB is the first impulse of the price movement on the chart
- BC is a correction from the first AB movement, ranging from 61.8% to 78.6%
- CD is the final wave, which could be 127.2% to 161.8% of the length of the BC wave, and should be roughly equal to the AB impulse
- The D-point is the final point in the pattern, where a reversal of quotes is expected
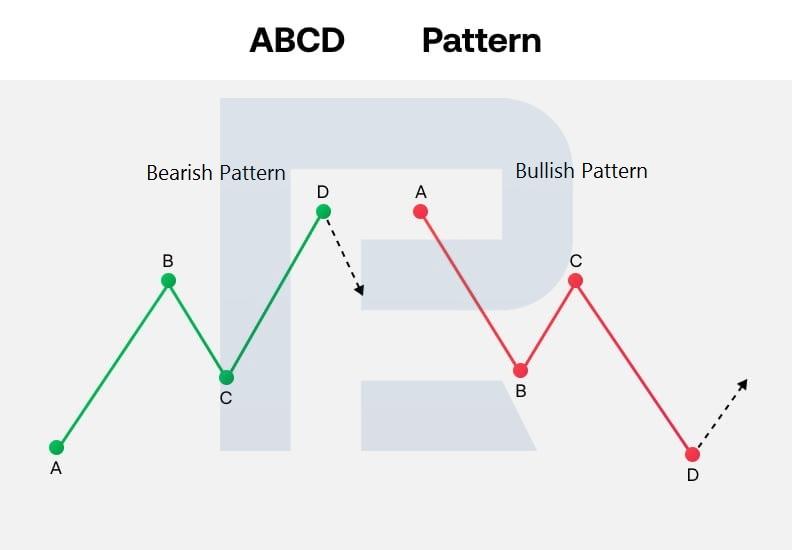
Bullish and bearish ABCD patternBat pattern
The Bat model was introduced by Scott Carney in 2001. It is characterised by a good Stop Loss to Take Profit ratio: usually 1:2 and above.
Stages in the formation of the Bat pattern:
- XA is the first impulse of the price movement on the chart
- AB is the correction from the first XA movement, ranging from 38.2% to 50%
- BC can range from 38.2% to 88.6% of the wavelength of AB
- CD, the final wave, constitutes an extension of 161.8% to 261.8% of the BC wavelength and ends at about the correction level of 88.6% of the XA wavelength
- The D-point is the final point in the pattern, where a reversal of quotes is expected
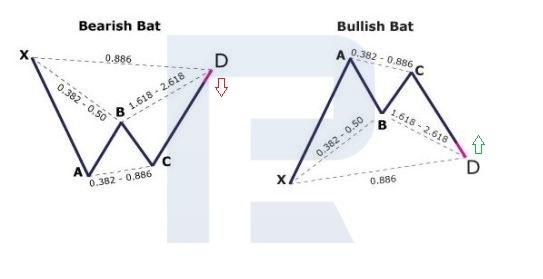
Bullish and bearish Bat patternShark pattern
The harmonic Shark pattern was described in 2011 by Scott Carney. Its appearance on the price chart signals a possible trend reversal. The formed pattern visually resembles a shark's fin or its open mouth.
Stages of Shark pattern formation:
- OX is the first impulse of the price movement on the chart
- XA is the correction from the first OX movement
- AB can range from 113% to 161.8% of the OX wavelength
- BC is the longest wavelength, ending at about 113% of the OX wavelength, and can be 161.8-224% of the AB wavelength
- Point C is the final point in the pattern where a reversal is expected
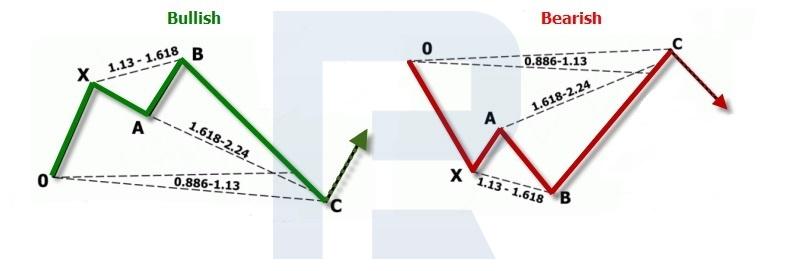
Bull and bear Shark patternConclusion
Many traders like to use harmonic patterns when trading. The combination of Fibonacci ratios with elements of Elliott Waves in these patterns helps to identify potential pivot points on the price chart and find trades with a good Stop Loss to Take Profit ratio.
Harmonic patterns are versatile: they can be used in different timeframes and financial markets. Special indicators have been created to automate their detection on the chart. Before using harmonic patterns in real trading, you should test their detection and execution on a demo account.
The post Harmonic Patterns in Trading appeared first at R Blog - RoboForex.
||
-----------------------------------------------------
By: Victor Gryazin
Title: Harmonic Patterns in Trading
Sourced From: blog.roboforex.com/blog/2022/12/30/harmonic-patterns-in-trading/
Published Date: Fri, 30 Dec 2022 15:12:00 +0000
Read More
.png) InvestingStocksToolsClubsVideosPrivacy PolicyTerms And Conditions
InvestingStocksToolsClubsVideosPrivacy PolicyTerms And Conditions
