||
Introduction to the Levels Indicator
Support and resistance levels are key elements on a price chart which traders should be aware of. This is because the market often takes interest on these levels, which often result in a strong market reaction. The Levels Indicator was developed to help traders identify potential support and resistance levels.
What is the Levels Indicator?
The Levels Indicator is a technical trading tool which helps traders identify horizontal support and resistance levels where price may reverse or break out from.
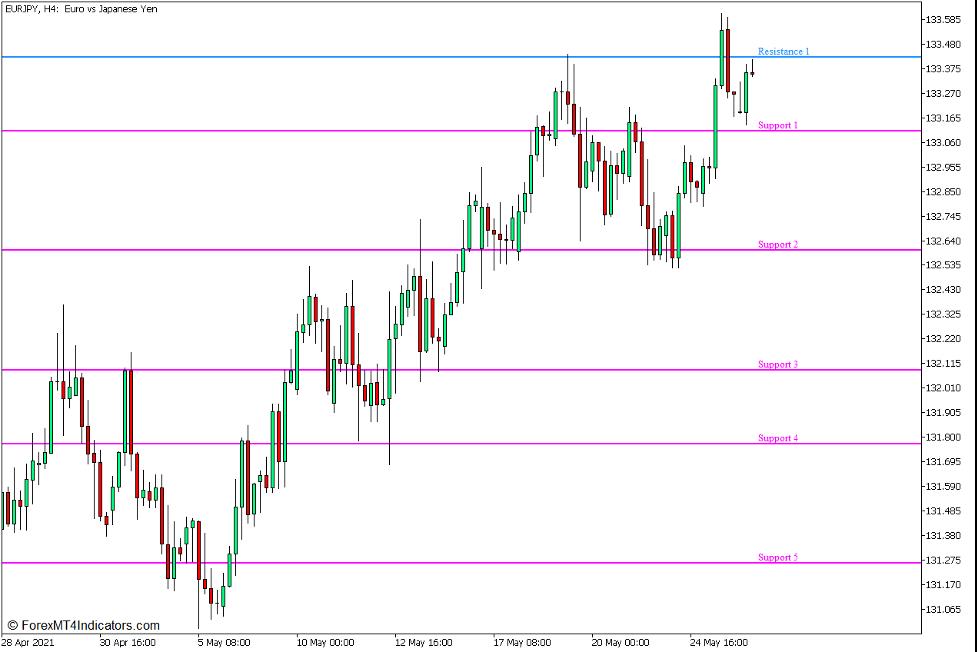
This indicator plots 10 horizontal lines, five of which are support levels and five of which are resistance levels. The support levels are in magenta while the resistance levels are in dodger blue. It also plots a label on each horizontal line shown on the far right edge of the price chart indicating whether the line is a support or resistance line.
How the Levels Indicator Works?
The Levels Indicator has a complex algorithm which calculates for the support and resistance levels using formulas that incorporate the price range, the close price, and Fibonacci ratios.
The indicator first calculates for the “Range” which is the difference between the high and the low of price. It then classifies the price range whether it is “Normal”, “Reduced”, or “Extended”. The indicator then assigns multipliers which are based on Fibonacci levels depending on the classification of the price range. The “Normal” range has a multiplier of 0.236 and 0.382. The “Reduced” price range has a multiplier of 0.146 and 0.236. The Extended price range has a multiplier of 0.382 and 0.618. The indicator then plugs in the multipliers on the different support and resistance level formulas. Each support and resistance level has its own formula which is derived from the price range.
How to use the Levels Indicator for MT5
The Levels Indicator has several options which modify the presentation of the support and resistance levels.
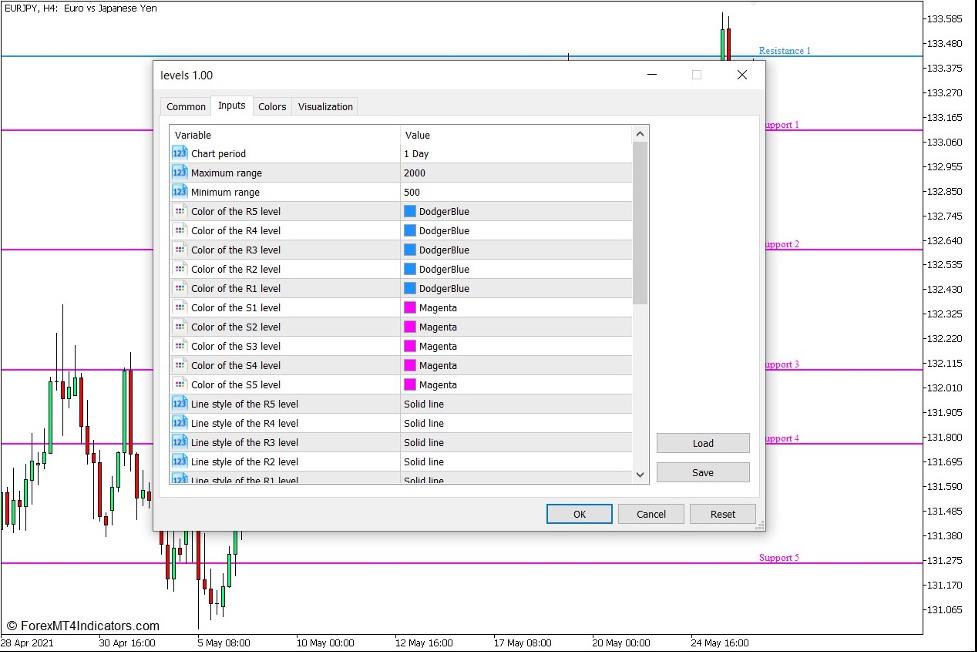
“Chart period” modifies the timeframe on which the price range is based on. This is preset as a 1 day range. This means that the calculations are based on the high and low of the day.
“Maximum range” and “Minimum range” refers to the maximum and minimum range in points in which the indicator would calculate for the support and resistance levels.
“Color…” allows users to choose the color which would be used to plots each support and resistance line.
“Line style…” allows users to choose what line style is used to plot each support and resistance line.
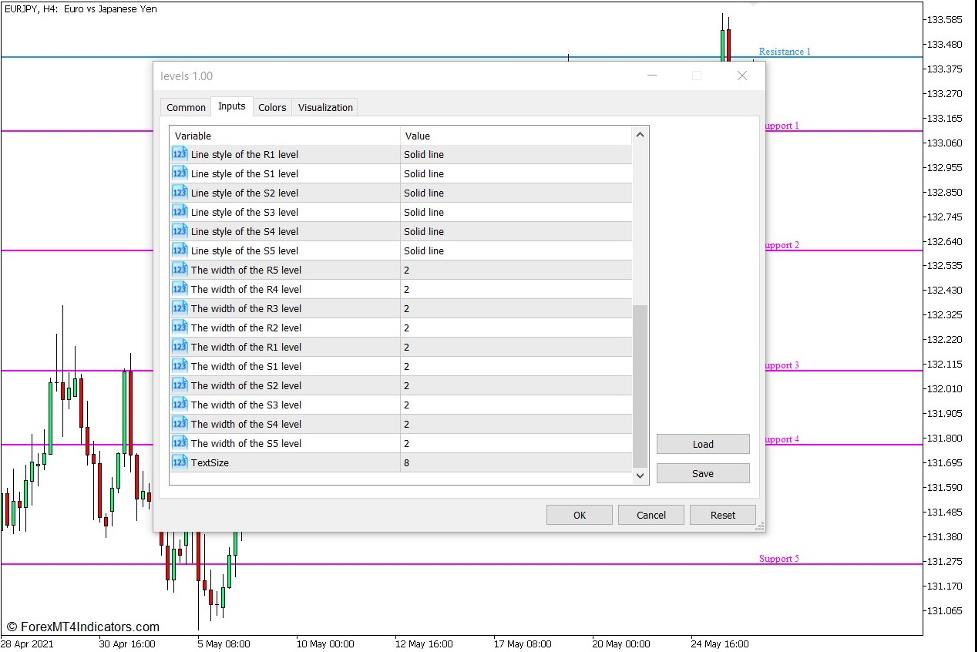
“The width…” allows users to modify the thickness of the lines which the indicator plots.
“TextSize” allows users to modify the text size of the labels placed on the far right edge of the chart.
Levels Indicator Applications
This indicator does not provide trade signals based on trends or momentum. Instead, it is very similar to the Pivot Point Indicator since it plots horizontal support and resistance levels based on a fixed formula. However, the formulas used to calculate for the classic Pivot Points is different from the formula used to calculate for the Levels support and resistance values. Traders can observe price action as it touches these levels and wait for possible reversal or momentum breakout signals.
Conclusion
The support and resistance levels that this indicator identifies often coincide with historical swing high and swing low areas. As such, traders can effectively incorporate this indicator with other strategies that use horizontal support and resistance levels. However, it is still best to use this indicator in confluence with other technical indications for better accuracy.
MT5 Indicators – Download Instructions
Levels Indicator for MT5 is a Metatrader 5 (MT5) indicator and the essence of this technical indicator is to transform the accumulated history data.
Levels Indicator for MT5 provides for an opportunity to detect various peculiarities and patterns in price dynamics which are invisible to the naked eye.
Based on this information, traders can assume further price movement and adjust their strategy accordingly. Click here for MT5 Strategies
Recommended Forex MetaTrader 5 Trading Platforms
#1 – XM Market
- Free $50 To Start Trading Instantly! (Withdrawable Profit)
- Deposit Bonus up to $5,000
- Unlimited Loyalty Program
- Award Winning Forex Broker
- Additional Exclusive Bonuses Throughout The Year

>> Claim Your $50 Bonus Here <<
Click Here for Step-By-Step XM Broker Account Opening Guide
#2 – Pocket Option
- Free +50% Bonus To Start Trading Instantly
- 9.6 Overall Rating!
- Automatically Credited To Your Account
- No Hidden Terms
- Accept USA Residents

How to install Levels Indicator for MT5.mq5 to your MetaTrader 5 Chart?
- Download Levels Indicator for MT5.mq5
- Copy Levels Indicator for MT5.mq5 to your Metatrader 5 Directory / experts / indicators /
- Start or restart your Metatrader 5 Client
- Select Chart and Timeframe where you want to test your mt5 indicator
- Search “Custom Indicators” in your Navigator mostly left in your Metatrader 5 Client
- Right click on Levels Indicator for MT5.mq5
- Attach to a chart
- Modify settings or press ok
- Indicator Levels Indicator for MT5.mq4 is available on your Chart
How to remove Levels Indicator for MT5.mq5 from your Metatrader 5 Chart?
- Select the Chart where is the Indicator running in your Metatrader 5 Client
- Right click into the Chart
- “Indicators list”
- Select the Indicator and delete
Levels Indicator for MT5 (Free Download)
Click here below to download:
Download Now
||
-----------------------------------------------------
By: Tim Morris
Title: Levels Indicator for MT5
Sourced From: www.forexmt4indicators.com/levels-indicator-for-mt5/?utm_source=rss&utm_medium=rss&utm_campaign=levels-indicator-for-mt5
Published Date: Fri, 20 Jan 2023 11:37:25 +0000
Read More
Did you miss our previous article...
https://peaceofmindinvesting.com/tools/what-is-opec-how-does-it-affect-oil-prices
.png) InvestingStocksToolsClubsVideosPrivacy PolicyTerms And Conditions
InvestingStocksToolsClubsVideosPrivacy PolicyTerms And Conditions
