||
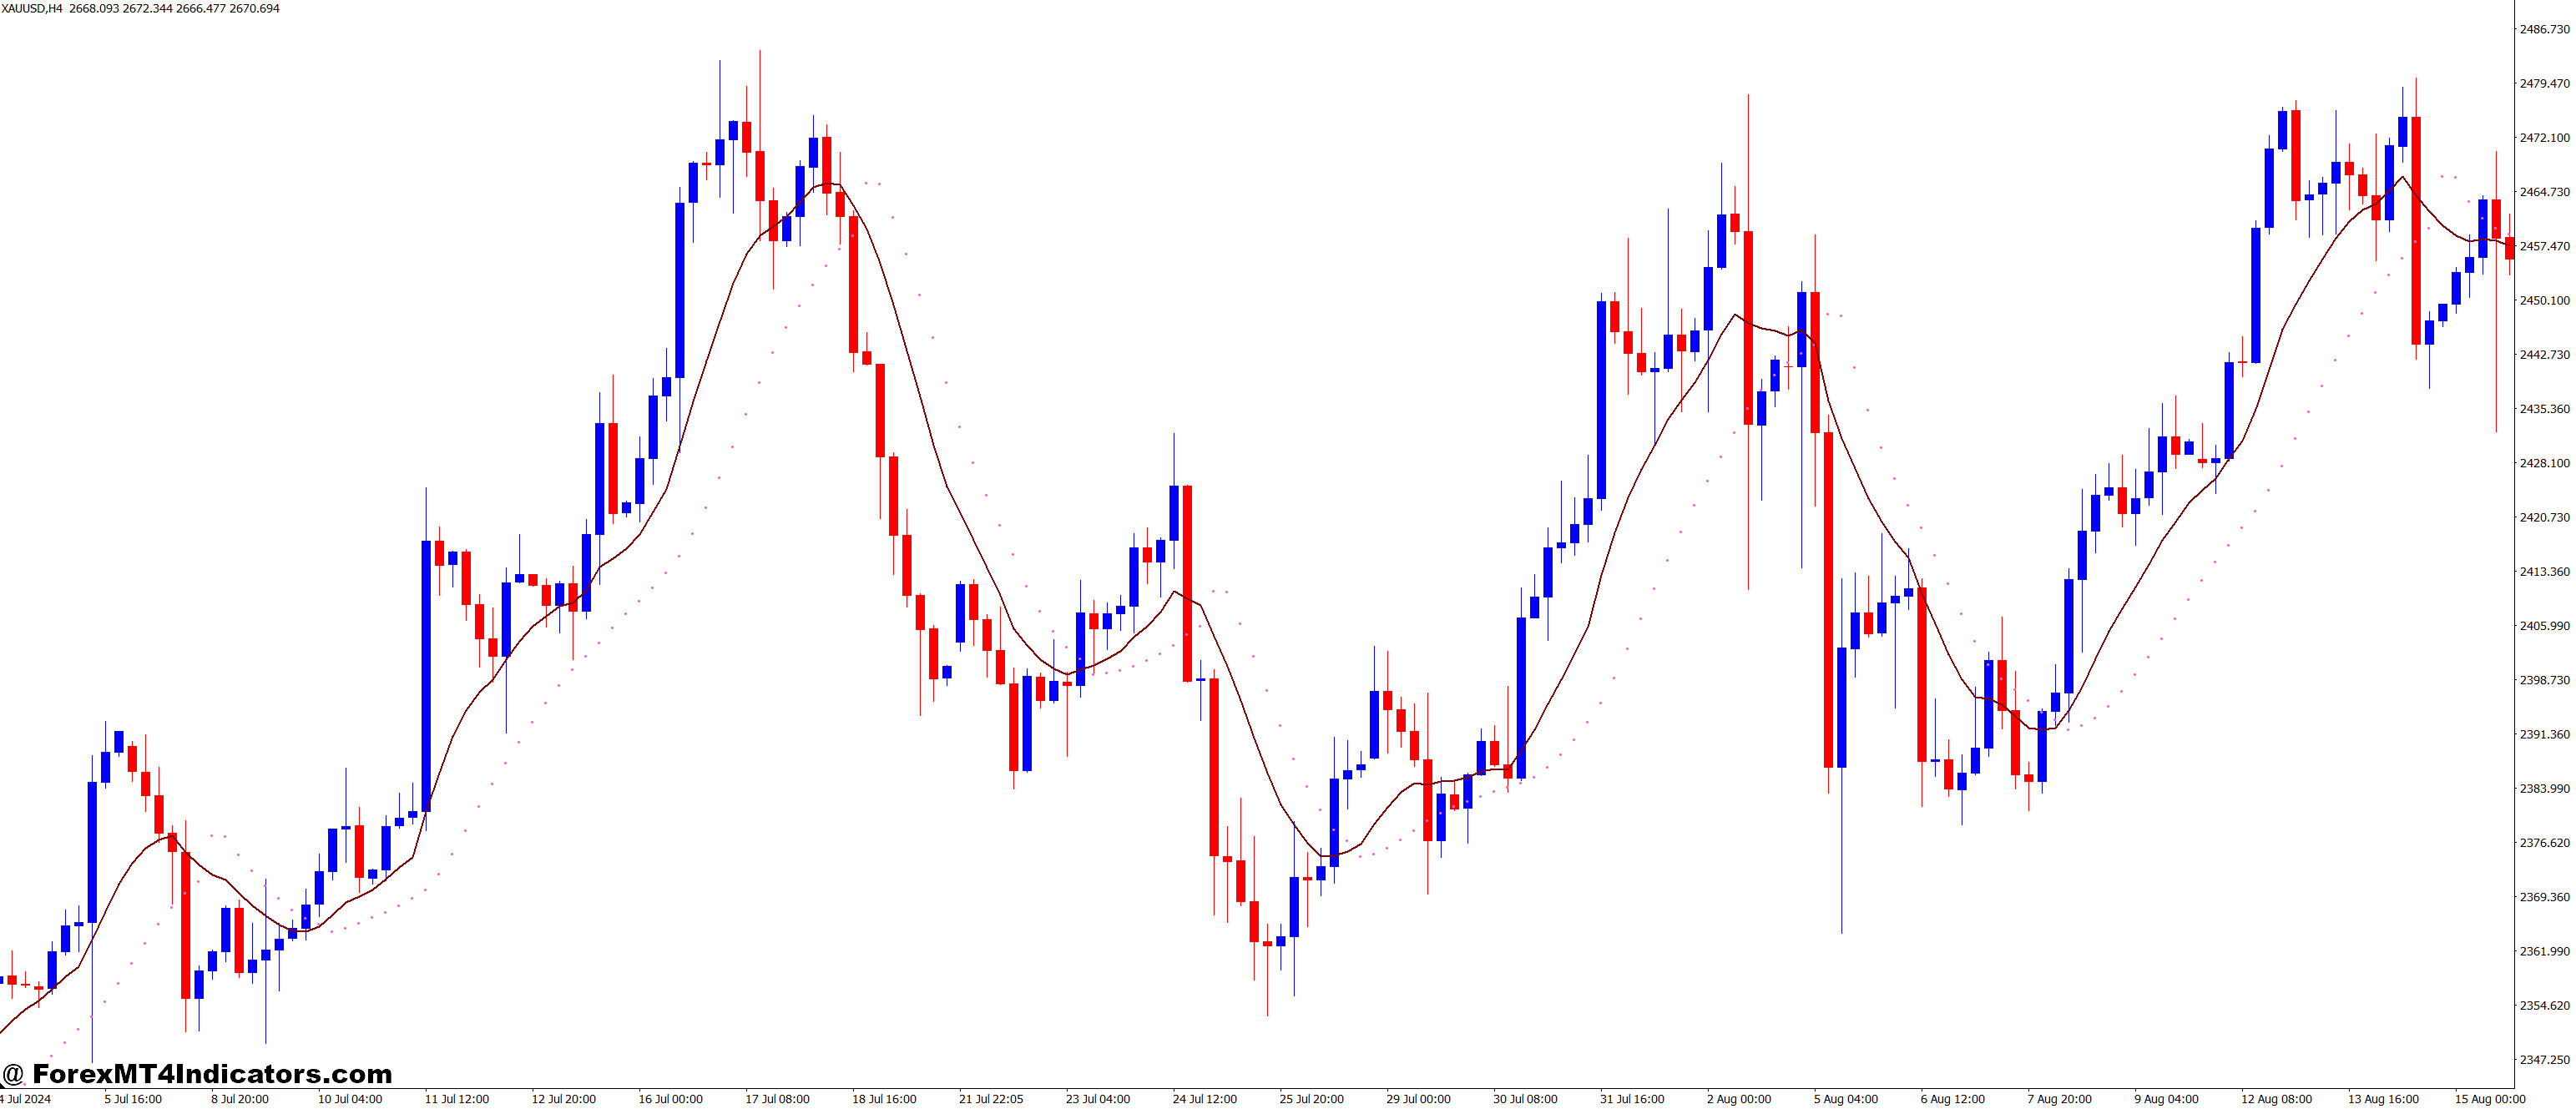
The Ma Parabolic ST2 is a custom trend-following indicator for MetaTrader 4. It combines two powerful tools: the moving average (MA) and the Parabolic SAR. The goal is to create a smoother, more responsive signal that helps traders catch trends early while filtering out false signals. This hybrid setup makes it especially useful during trending markets, where timing is everything.
How It Works on the Chart
When you apply this indicator to your chart, it places dots or lines that change color depending on the market direction. If the price is in an uptrend, the indicator shows it clearly; when the trend reverses, the color switches, giving a visual cue to exit or go short. It reacts faster than standard MAs and offers more stability than standalone SAR tools. This makes it ideal for swing traders and intraday traders who want clearer trend setups.
Why Traders Prefer It
One of the best things about the Ma Parabolic ST2 is its simplicity. You don’t need to be a technical analysis expert to use it. The clear signals help reduce confusion, especially for beginners. Plus, it can be used with almost any trading strategy—whether you’re into forex, indices, or commodities. Many traders say it helps them stay on the right side of the market and avoid choppy zones.
Tips for Using It Effectively

To get the most from this indicator, it’s best to use it with other confirmations, like support/resistance zones or volume analysis. It’s not a magic tool, but it adds a solid layer of clarity to your setup. Set alerts when the color changes, and always check for market context before jumping into trades. With smart use, this indicator can help improve decision-making and boost confidence.
How to Trade with Ma Parabolic ST2 MT4 Indicator
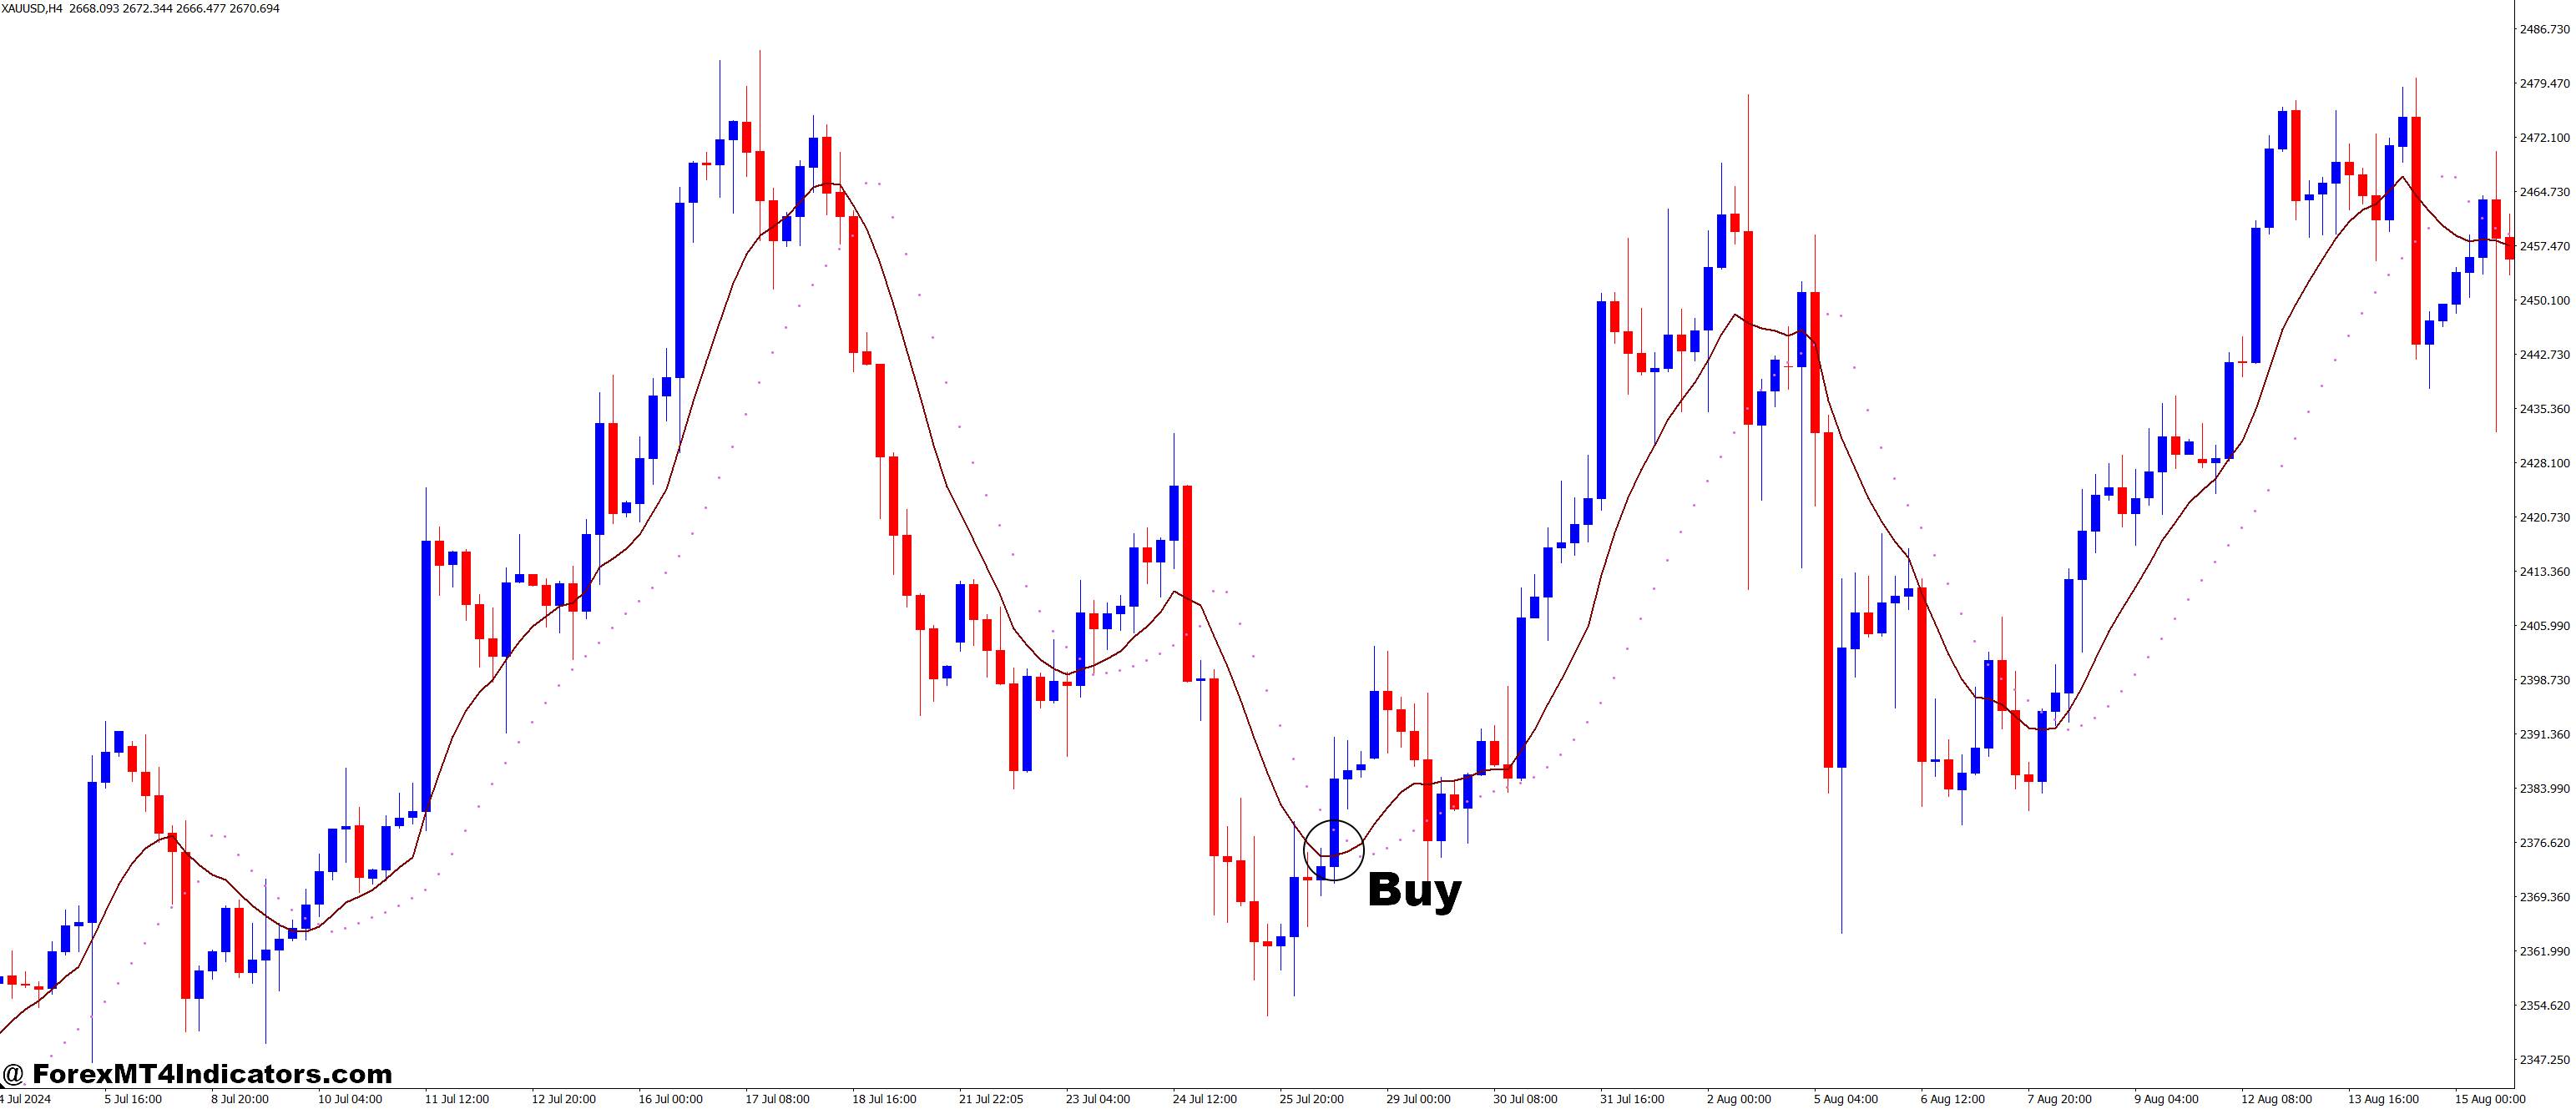
Buy Entry

- Wait for the indicator to switch to a bullish color (usually green or blue dots/lines).
- Ensure the dots/lines are below the price candles, signaling upward momentum.
- Confirm that the market is making higher highs and higher lows.
- Enter a buy position on the next candle after the color change.
- Place your stop loss just below the most recent swing low.
- Consider taking profit at the next resistance level or using a trailing stop.
Sell Entry

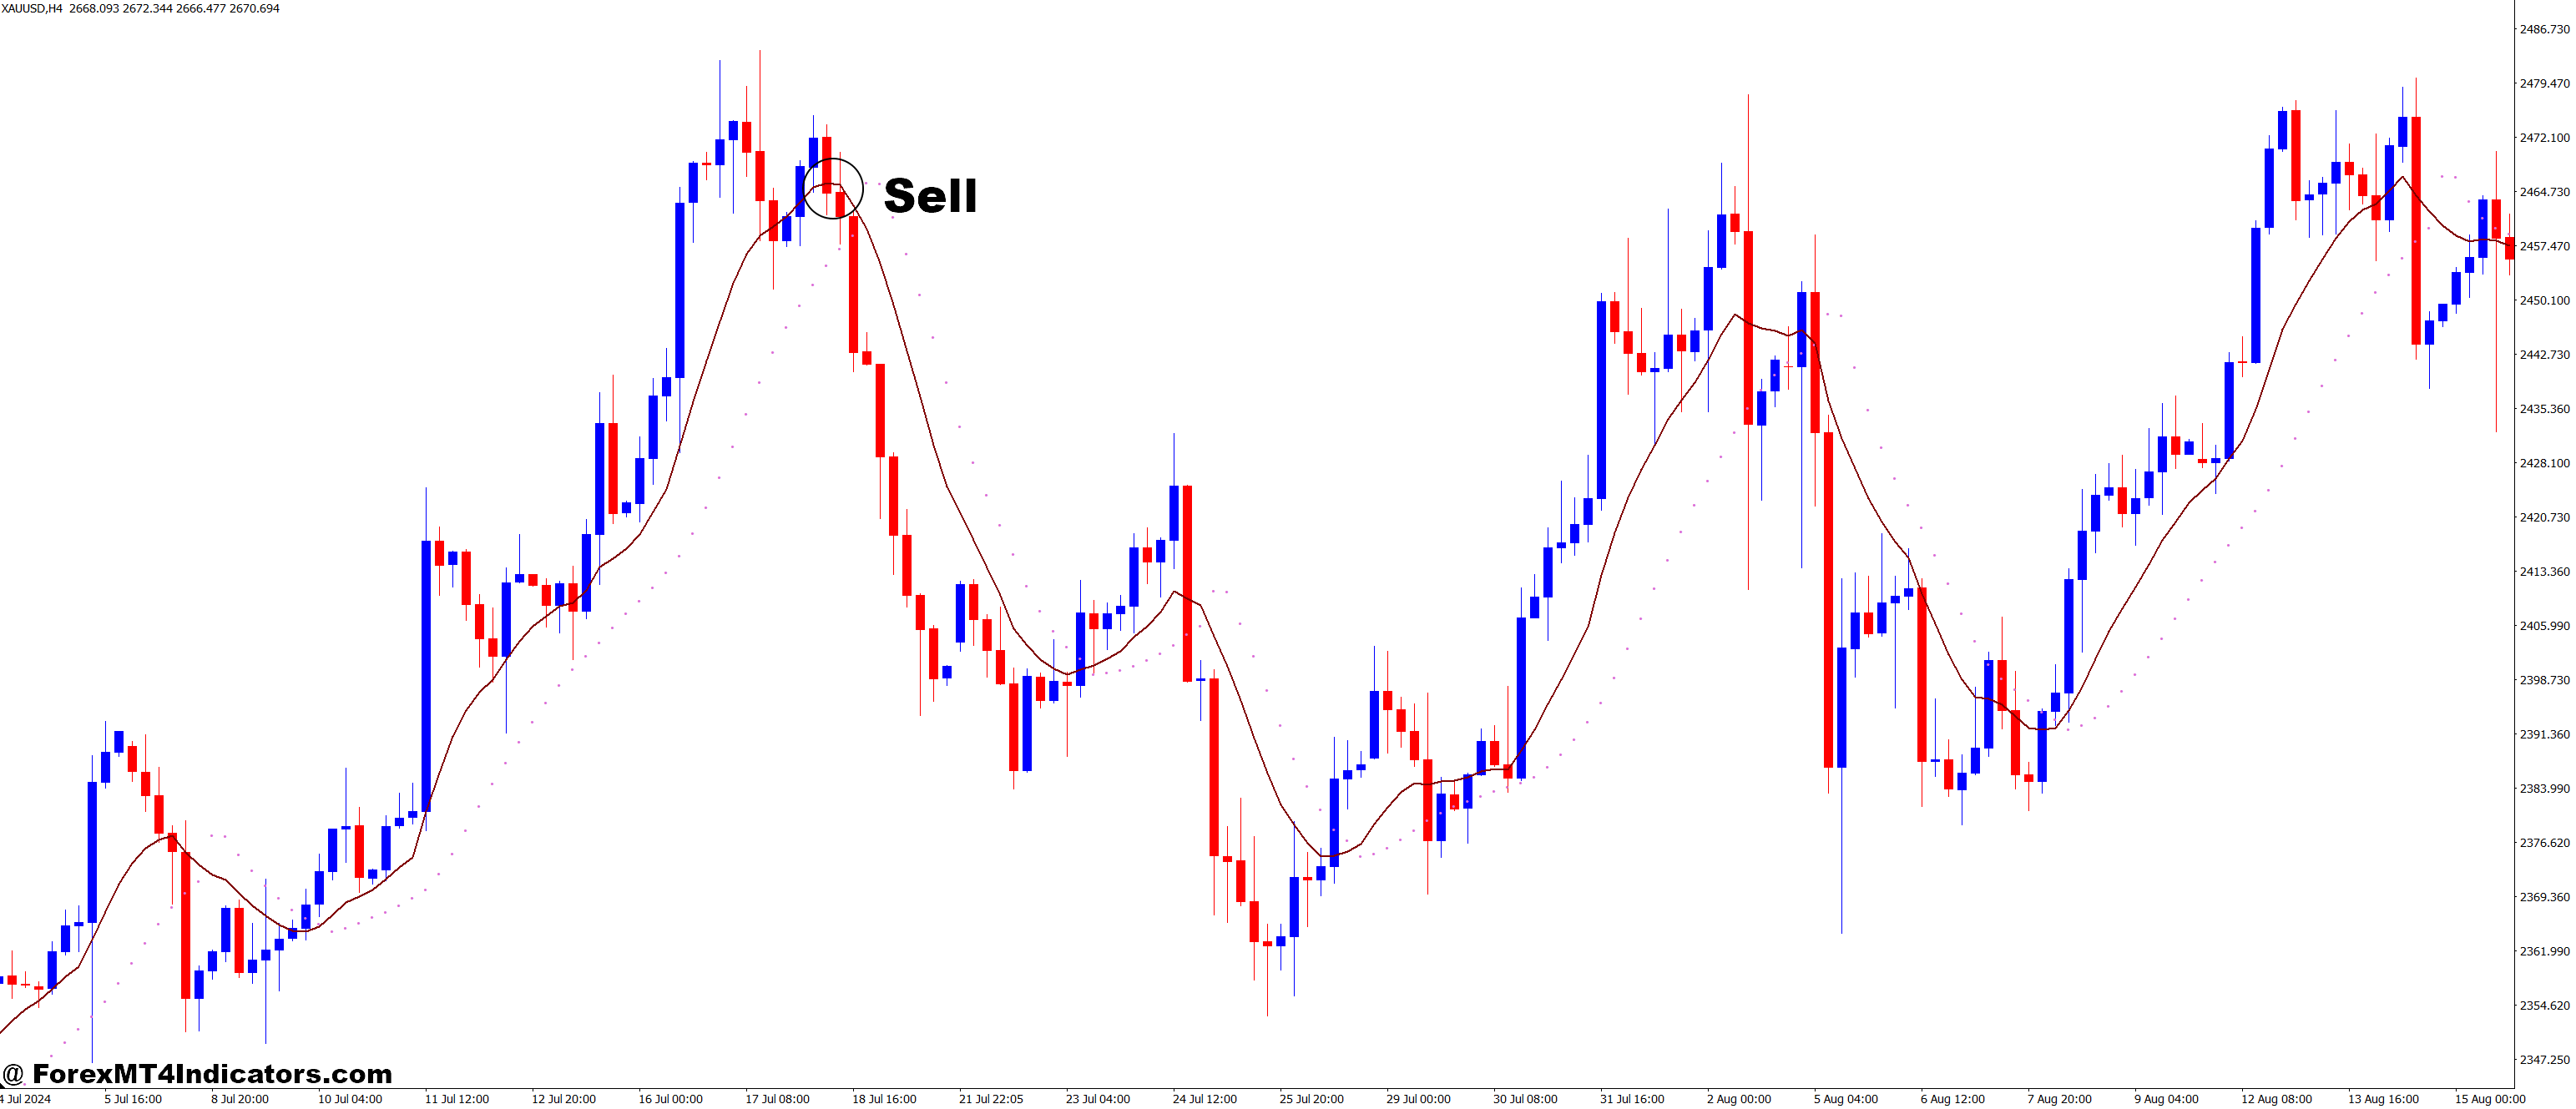
- Wait for the indicator to switch to a bearish color (usually red or orange dots/lines).
- Make sure the dots/lines are above the price candles, indicating downward momentum.
- Confirm that the market is forming lower highs and lower lows.
- Enter a sell position on the next candle after the color change.
- Place your stop loss just above the most recent swing high.
- Consider exiting at the next support level or using a trailing stop for bigger moves.
Conclusion
The Ma Parabolic ST2 MT4 Indicator offers a clean, easy-to-read approach to identifying trends. By combining moving averages with parabolic SAR features, it helps traders make quicker and smarter trading choices. Whether you’re just starting or looking to sharpen your strategy, this indicator might just give you the edge you need.
Recommended MT4/MT5 Broker
XM Broker
- Free $50 To Start Trading Instantly! (Withdraw-able Profit)
- Deposit Bonus up to $5,000
- Unlimited Loyalty Program
- Award Winning Forex Broker
- Additional Exclusive Bonuses Throughout The Year
- Exclusive 50% Cash Rebates for all Trades!

>> Sign Up for XM Broker Account here with Exclusive 50% Cash Rebates For All Future Trades [Use This Special Invitation Link] <<
Already an XM client but missing out on cashback? Open New Real Account and Enter this Partner Code: 𝟕𝐖𝟑𝐉𝐐
(Free MT4 Indicators Download)

||
-----------------------------------------------------
By: Tim Morris
Title: Ma Parabolic ST2 MT4 Indicator
Sourced From: forexmt4indicators.com/ma-parabolic-st2-mt4-indicator/?utm_source=rss&utm_medium=rss&utm_campaign=ma-parabolic-st2-mt4-indicator
Published Date: Wed, 21 May 2025 07:00:52 +0000
Read More
.png) InvestingStocksToolsClubsVideosPrivacy PolicyTerms And Conditions
InvestingStocksToolsClubsVideosPrivacy PolicyTerms And Conditions
