||
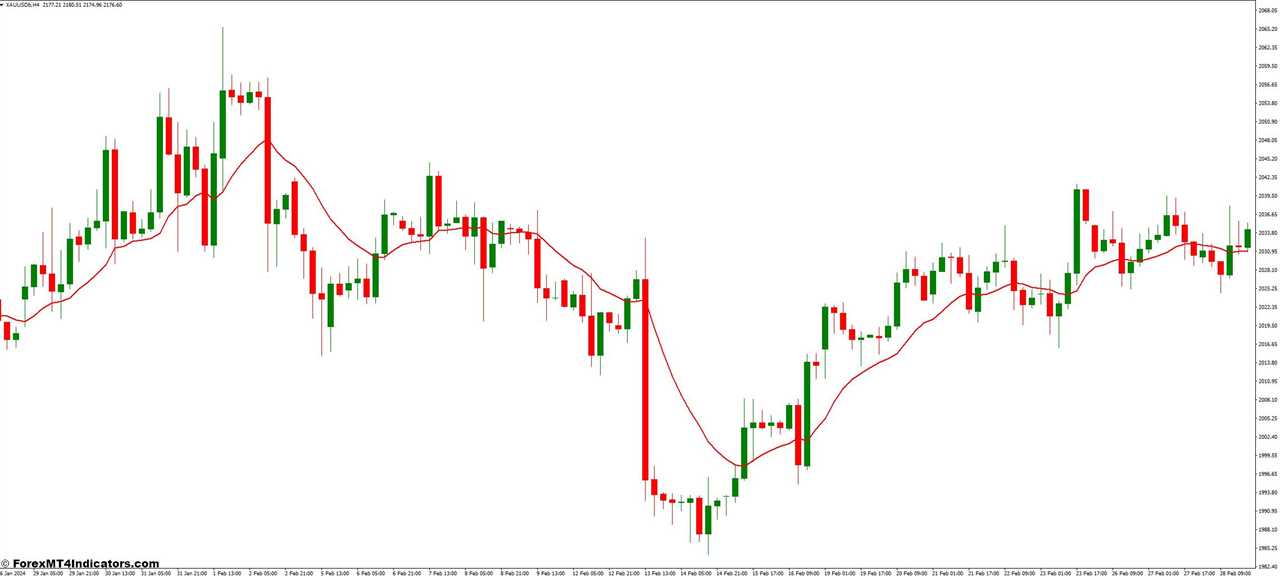
The ever-evolving world of forex trading demands a toolbox brimming with reliable indicators to navigate the market’s complexities. Among this arsenal, the McGinley Dynamic MT4 Indicator stands out as a powerful tool for traders seeking an edge. But what exactly is this indicator, and how can it empower your trading decisions? Buckle up, because we’re about to delve into the fascinating world of the McGinley Dynamic!
Unveiling the McGinley Dynamic
The McGinley Dynamic indicator boasts a rich history, developed by John McGinley in the late 20th century. McGinley, a seasoned trader, sought to create an indicator that addressed some shortcomings he observed in traditional moving averages. The result? The McGinley Dynamic is a unique indicator that offers smoother price filtering and potentially sharper trend identification – a true game-changer for traders seeking a clearer view of market direction.
How the McGinley Dynamic Calculates Values
Now, let’s peel back the hood and examine the inner workings of this intriguing indicator. Unlike traditional moving averages that simply average past closing prices, the McGinley Dynamic employs a more intricate calculation process. It incorporates a weighted average of closing prices, along with prior period averages, to generate its value. This unique approach aims to reduce noise and enhance the overall smoothness of the indicator, potentially leading to a clearer picture of the underlying trend.
Here’s a simplified breakdown of the calculation (don’t worry, you won’t need a Ph.D. in mathematics!):
- The McGinley Dynamic takes into account a specific number of past closing prices (defined by the indicator’s period setting).
- It assigns weights to these closing prices, with more recent prices receiving higher weightage.
- The indicator then factors in a portion of the previous period’s McGinley Dynamic value.
- This combination of weighted closing prices and the past McGinley Dynamic value generates the current indicator value.
Distinguishing the McGinley Dynamic from TMA
So, why should you consider the McGinley Dynamic over the tried-and-true moving averages? Here’s the deal: traditional moving averages (TMA), while valuable tools, can sometimes suffer from excessive lag, meaning they react slowly to price changes. This lag can lead to missed trading opportunities or premature exits.
The McGinley Dynamic, with its emphasis on weighted averages and incorporating past indicator values, strives to offer a more responsive representation of price action. This potentially translates to smoother trend identification and swifter reaction times when entering or exiting trades.
Remember, though, that no indicator is a crystal ball. Market conditions can be highly volatile, and relying solely on any single indicator can be risky. However, the McGinley Dynamic, when used in conjunction with other technical analysis tools and sound trading strategies, can become a valuable asset in your trading arsenal.
Interpreting the Indicator’s Signals for Informed Trading Decisions
Now that you’ve got the McGinley Dynamic up and running, how do you decipher its signals? Here are some key interpretations to keep in mind:
- Upward Slope: A rising McGinley Dynamic typically suggests an underlying uptrend. This can be a potential signal for buying opportunities, especially if the indicator is also above price bars. Conversely, a McGinley Dynamic that consistently dips below price bars might indicate a downtrend, potentially suggesting selling opportunities.
- Crossovers: Similar to moving averages, the McGinley Dynamic can generate crossover signals. When the indicator cuts above the price bars (bullish crossover), it can signal a potential trend reversal from bearish to bullish. Conversely, a bearish crossover occurs when the indicator dips below the price bars, suggesting a possible shift from bullish to bearish.
- Divergence: Divergence is a powerful signal that can warn of potential trend exhaustion. When price action makes new highs (or lows) but the McGinley Dynamic fails to follow suit, it can indicate a weakening trend. This divergence can be a cue to be cautious about entering new trades in the direction of the price movement.
Unveiling the Power of the McGinley Dynamic
So, why should you consider incorporating the McGinley Dynamic into your trading toolbox? Here are some compelling reasons:
- Enhanced Price Smoothing and Reduced Noise: Compared to traditional moving averages, the McGinley Dynamic’s calculation method can lead to a smoother representation of price movements. This smoothing effect helps to filter out minor price fluctuations (noise) and potentially provides a clearer view of the underlying trend.
- Potential for Improved Trend Identification: By reducing noise and offering a smoother visual representation, the McGinley Dynamic can potentially aid in identifying trends more effectively. This can be particularly helpful for traders who struggle with the sometimes choppy nature of traditional moving averages.
- Faster Reaction Time: The McGinley Dynamic’s incorporation of past indicator values can lead to a more responsive indicator compared to traditional moving averages. This potentially translates to swifter reaction times when entering or exiting trades, especially in volatile market conditions.
Understanding the Limitations of the McGinley Dynamic
As with any technical indicator, the McGinley Dynamic is not a magic formula for trading success. Here are some key limitations to keep in mind:
- Market Volatility: The McGinley Dynamic, like all technical indicators, can be challenged by highly volatile markets. During periods of erratic price swings, the indicator’s signals might become less reliable.
- Lag: While the McGinley Dynamic strives to be more responsive than traditional moving averages, it still inherently possesses some lag. This means the indicator might not always perfectly capture the latest price movements.
- Confirmation is Key: Never rely solely on the McGinley Dynamic to make trading decisions. Always use it in conjunction with other technical analysis tools and confirmation from the price action itself.
Utilizing the McGinley Dynamic for Advanced Techniques
The McGinley Dynamic’s versatility extends beyond basic trend identification. Here are some advanced strategies to explore:
- Leveraging Divergence for Trade Confirmation: As mentioned earlier, the divergence between the McGinley Dynamic and price action can be a powerful signal. By incorporating divergence analysis into your strategy, you can potentially confirm trend reversals and avoid entering trades against the underlying market momentum.
- Combining the Indicator with Other Technical Analysis Tools: The McGinley Dynamic shines when used alongside other technical indicators like the Relative Strength Index (RSI) or Stochastic Oscillator. By combining these tools, you can gain a more well-rounded perspective of market conditions and identify potential trading opportunities with greater confidence.
- Backtesting Strategies to Refine Your Approach: Backtesting allows you to test your trading strategies using historical market data. This is a fantastic way to explore how the McGinley Dynamic interacts with other indicators and price action in different market scenarios. By backtesting, you can refine your approach and develop a trading strategy tailored to your risk tolerance and trading style.
How to Trade with the McGinley Dynamic Indicator
Buy Entry
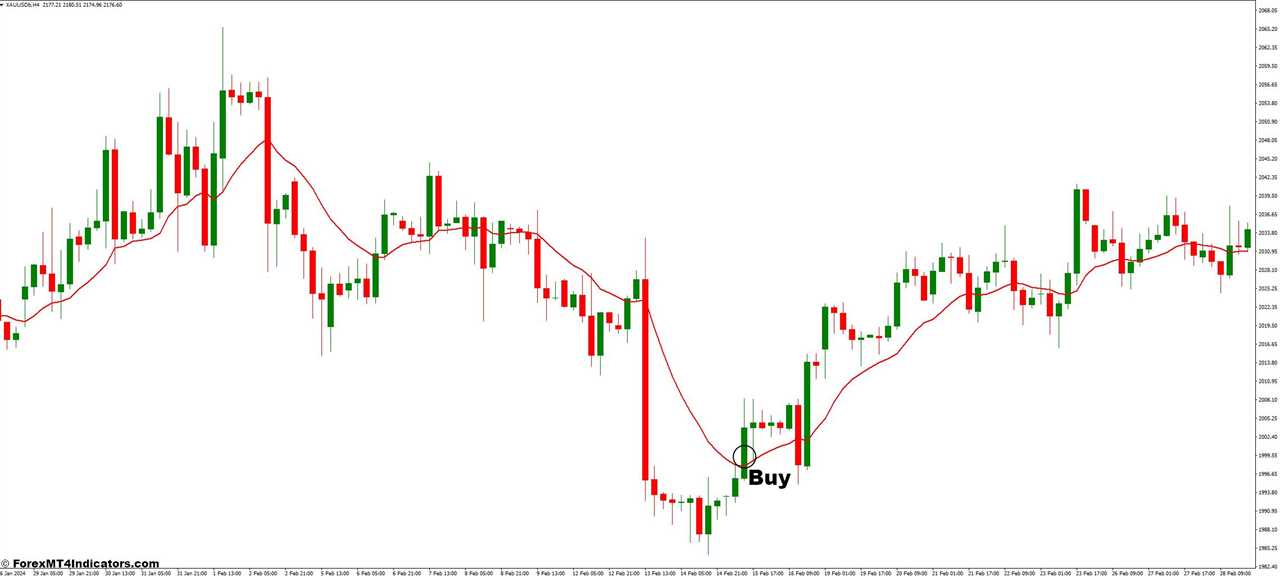
- Look for a bullish crossover, where the McGinley Dynamic line crosses above the price bars.
- Confirmation: Ideally, the price should be trading above the McGinley Dynamic after the crossover.
- Place your stop-loss order below the recent swing low before the bullish crossover.
- Consider taking profits when the price reaches a resistance level or when the McGinley Dynamic starts to curve downwards.
Sell Entry
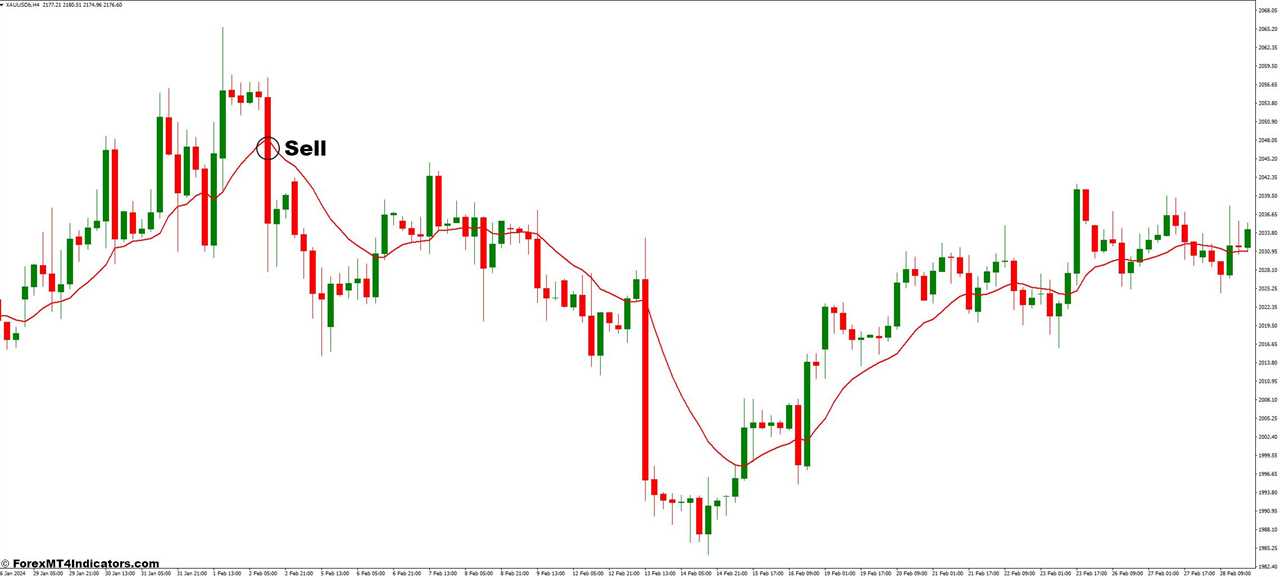
- Look for a bearish crossover, where the McGinley Dynamic line crosses below the price bars.
- Confirmation: Ideally, the price should be trading below the McGinley Dynamic after the crossover.
- Stop-Loss:
- Place your stop-loss order above the recent swing high before the bearish crossover.
- Take-Profit:
- Consider taking profits when the price reaches a support level or when the McGinley Dynamic starts to curve upwards.
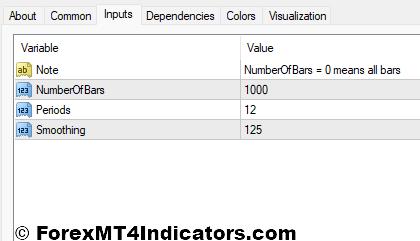
McGinley Dynamic Indicator Settings
Conclusion
McGinley Dynamic MT4 Indicator presents itself as a valuable tool for traders seeking to enhance their technical analysis. By incorporating its smoother price representation and potential for faster reaction times, traders can gain a potentially clearer view of market trends and identify trading opportunities with greater confidence.
Recommended MT4/MT5 Brokers
XM Broker
- Free $50 To Start Trading Instantly! (Withdraw-able Profit)
- Deposit Bonus up to $5,000
- Unlimited Loyalty Program
- Award Winning Forex Broker
- Additional Exclusive Bonuses Throughout The Year

>> Sign Up for XM Broker Account here <<
FBS Broker
- Trade 100 Bonus: Free $100 to kickstart your trading journey!
- 100% Deposit Bonus: Double your deposit up to $10,000 and trade with enhanced capital.
- Leverage up to 1:3000: Maximizing potential profits with one of the highest leverage options available.
- ‘Best Customer Service Broker Asia’ Award: Recognized excellence in customer support and service.
- Seasonal Promotions: Enjoy a variety of exclusive bonuses and promotional offers all year round.

>> Sign Up for FBS Broker Account here <<

(Free MT4 Indicators Download)
Click here below to download:
Mcginley Dynamic MT4 Indicator
||
-----------------------------------------------------
By: Tim Morris
Title: Mcginley Dynamic MT4 Indicator
Sourced From: www.forexmt4indicators.com/mcginley-dynamic-mt4-indicator/?utm_source=rss&utm_medium=rss&utm_campaign=mcginley-dynamic-mt4-indicator
Published Date: Sun, 19 May 2024 01:00:38 +0000
Read More
.png) InvestingStocksToolsClubsVideosPrivacy PolicyTerms And Conditions
InvestingStocksToolsClubsVideosPrivacy PolicyTerms And Conditions
