||
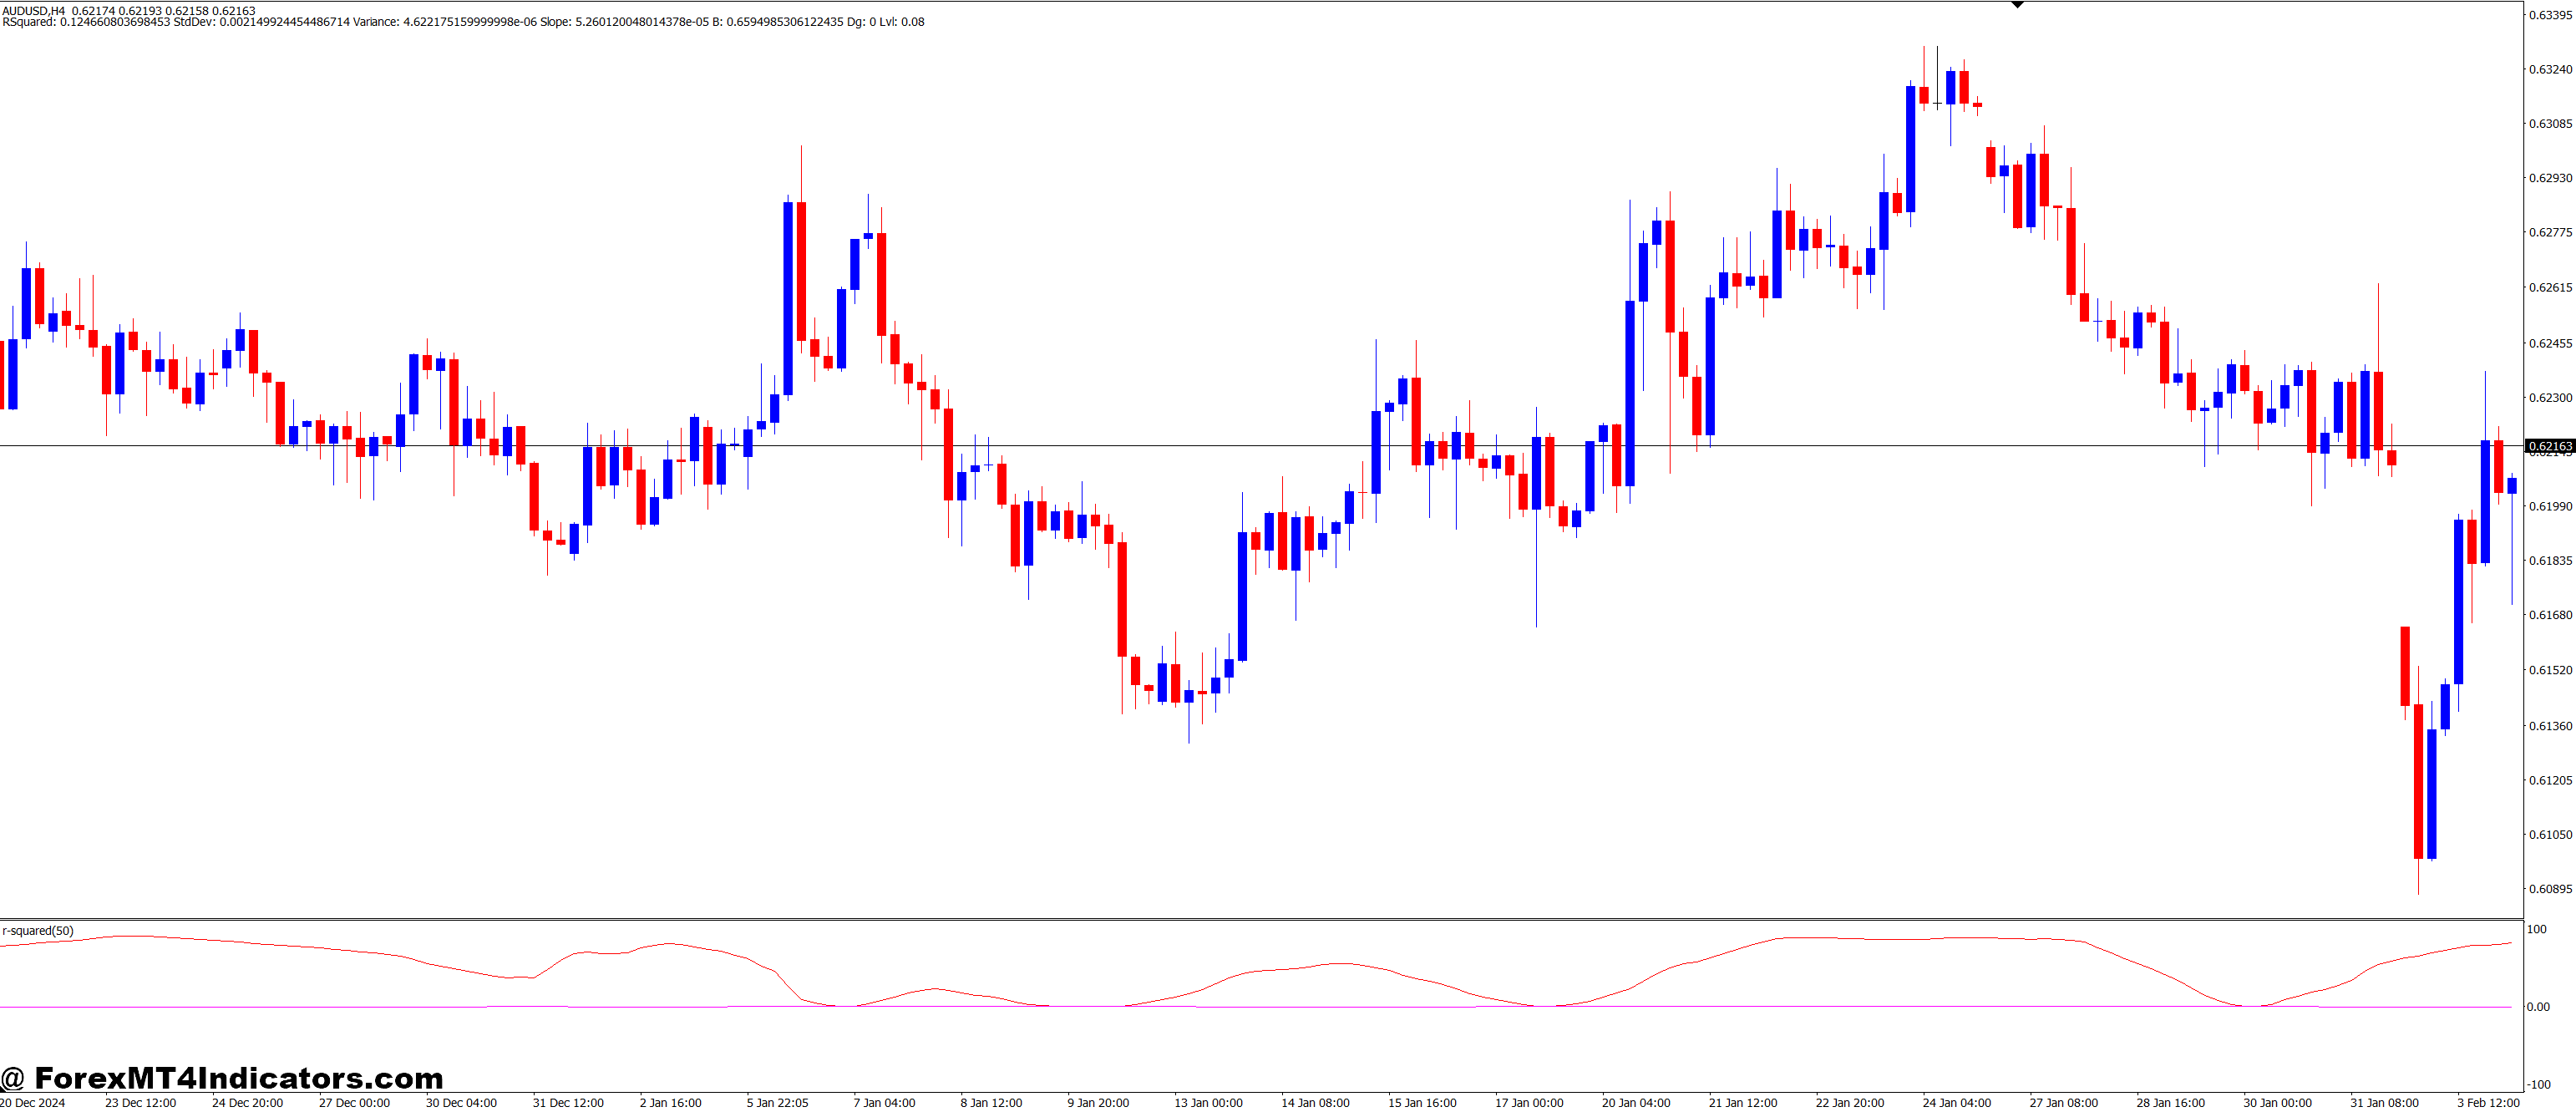
The R-squared (R²) indicator is a statistical measure that helps traders assess the strength of a market trend. It measures the degree of correlation between price movements and a linear regression line. The R-squared value ranges from 0 to 1, with a value closer to 1 indicating a stronger correlation. In trading, this means that the market is moving in a predictable direction. When the R-squared value is high, traders can be more confident that the trend will continue. This allows traders to make more precise predictions about future price movements.
The Linear Regression indicator, on the other hand, plots a straight line through the historical price data, representing the “best fit” for the price movement. The line indicates the overall direction of the market, whether it is upward, downward, or neutral. Traders use the Linear Regression line to spot trends and forecast future price movements. When price levels deviate significantly from this line, it can signal that the market is overbought or oversold, which might indicate an impending reversal.
How Do R-squared and Linear Regression Work Together?
When used together, the R-squared and Linear Regression indicators provide a comprehensive view of market behavior. The Linear Regression line gives traders a visual representation of the market trend, while the R-squared indicator quantifies how well the data fits that trend. For example, if the R-squared value is high, it indicates that the price movement closely follows the Linear Regression line, confirming that the trend is strong and reliable.
Traders can use this combination to identify entry and exit points. A strong R-squared value supports the reliability of the Linear Regression line, making it a more dependable guide for predicting future price actions. If the price deviates significantly from the regression line and the R-squared value drops, it can indicate that the trend is weakening, suggesting a potential reversal. This helps traders adjust their strategies to minimize risk and maximize profits.
Benefits of Using R-Squared and Linear Regression on MT4
The R-squared and Linear Regression indicators are especially valuable for traders using MetaTrader 4, as they integrate seamlessly into the platform and provide real-time data analysis. Traders can use these indicators to enhance their trading strategies in several ways:
- Trend Confirmation: The combination of R-squared and Linear Regression provides a clearer picture of the market trend. When both indicators show strong alignment, traders can confidently follow the trend, reducing the likelihood of making poor trading decisions.
- Identifying Trend Reversals: If the price starts to deviate from the Linear Regression line and the R-squared value drops, it can signal a trend reversal. This insight helps traders avoid chasing trends that are about to end and enter trades with better timing.
- Risk Management: By using these indicators, traders can better assess the strength of a trend and adjust their risk levels accordingly. For example, when the R-squared value is high, traders can increase their position size or hold onto trades longer, knowing the trend is likely to continue. Conversely, if the R-squared value is low, traders may choose to scale back their positions or exit early to minimize losses.
- Predicting Price Movements: The Linear Regression line offers a visual representation of potential price movement, while the R-squared indicator provides statistical evidence that the price is following the trend. This combination allows traders to forecast where the price might go next with greater accuracy.
Practical Tips for Using R-Squared and Linear Regression on MT4

To make the most of these indicators, traders should integrate them into a broader trading strategy. Here are a few practical tips:
- Combine with Other Indicators: While R-squared and Linear Regression are powerful tools, they work best when combined with other indicators, such as moving averages or oscillators. Using multiple indicators helps confirm signals and improve accuracy.
- Focus on Timeframes: The effectiveness of these indicators can vary depending on the timeframe being analyzed. Traders should test these indicators across different timeframes to determine which works best for their trading style.
- Adjust Parameters: Both the R-squared and Linear Regression indicators can be customized in MT4. Traders should experiment with different settings to find what works best for their strategy and the market conditions they’re trading in.
How to Trade with R-Squared and Linear Regression MT4 Indicator
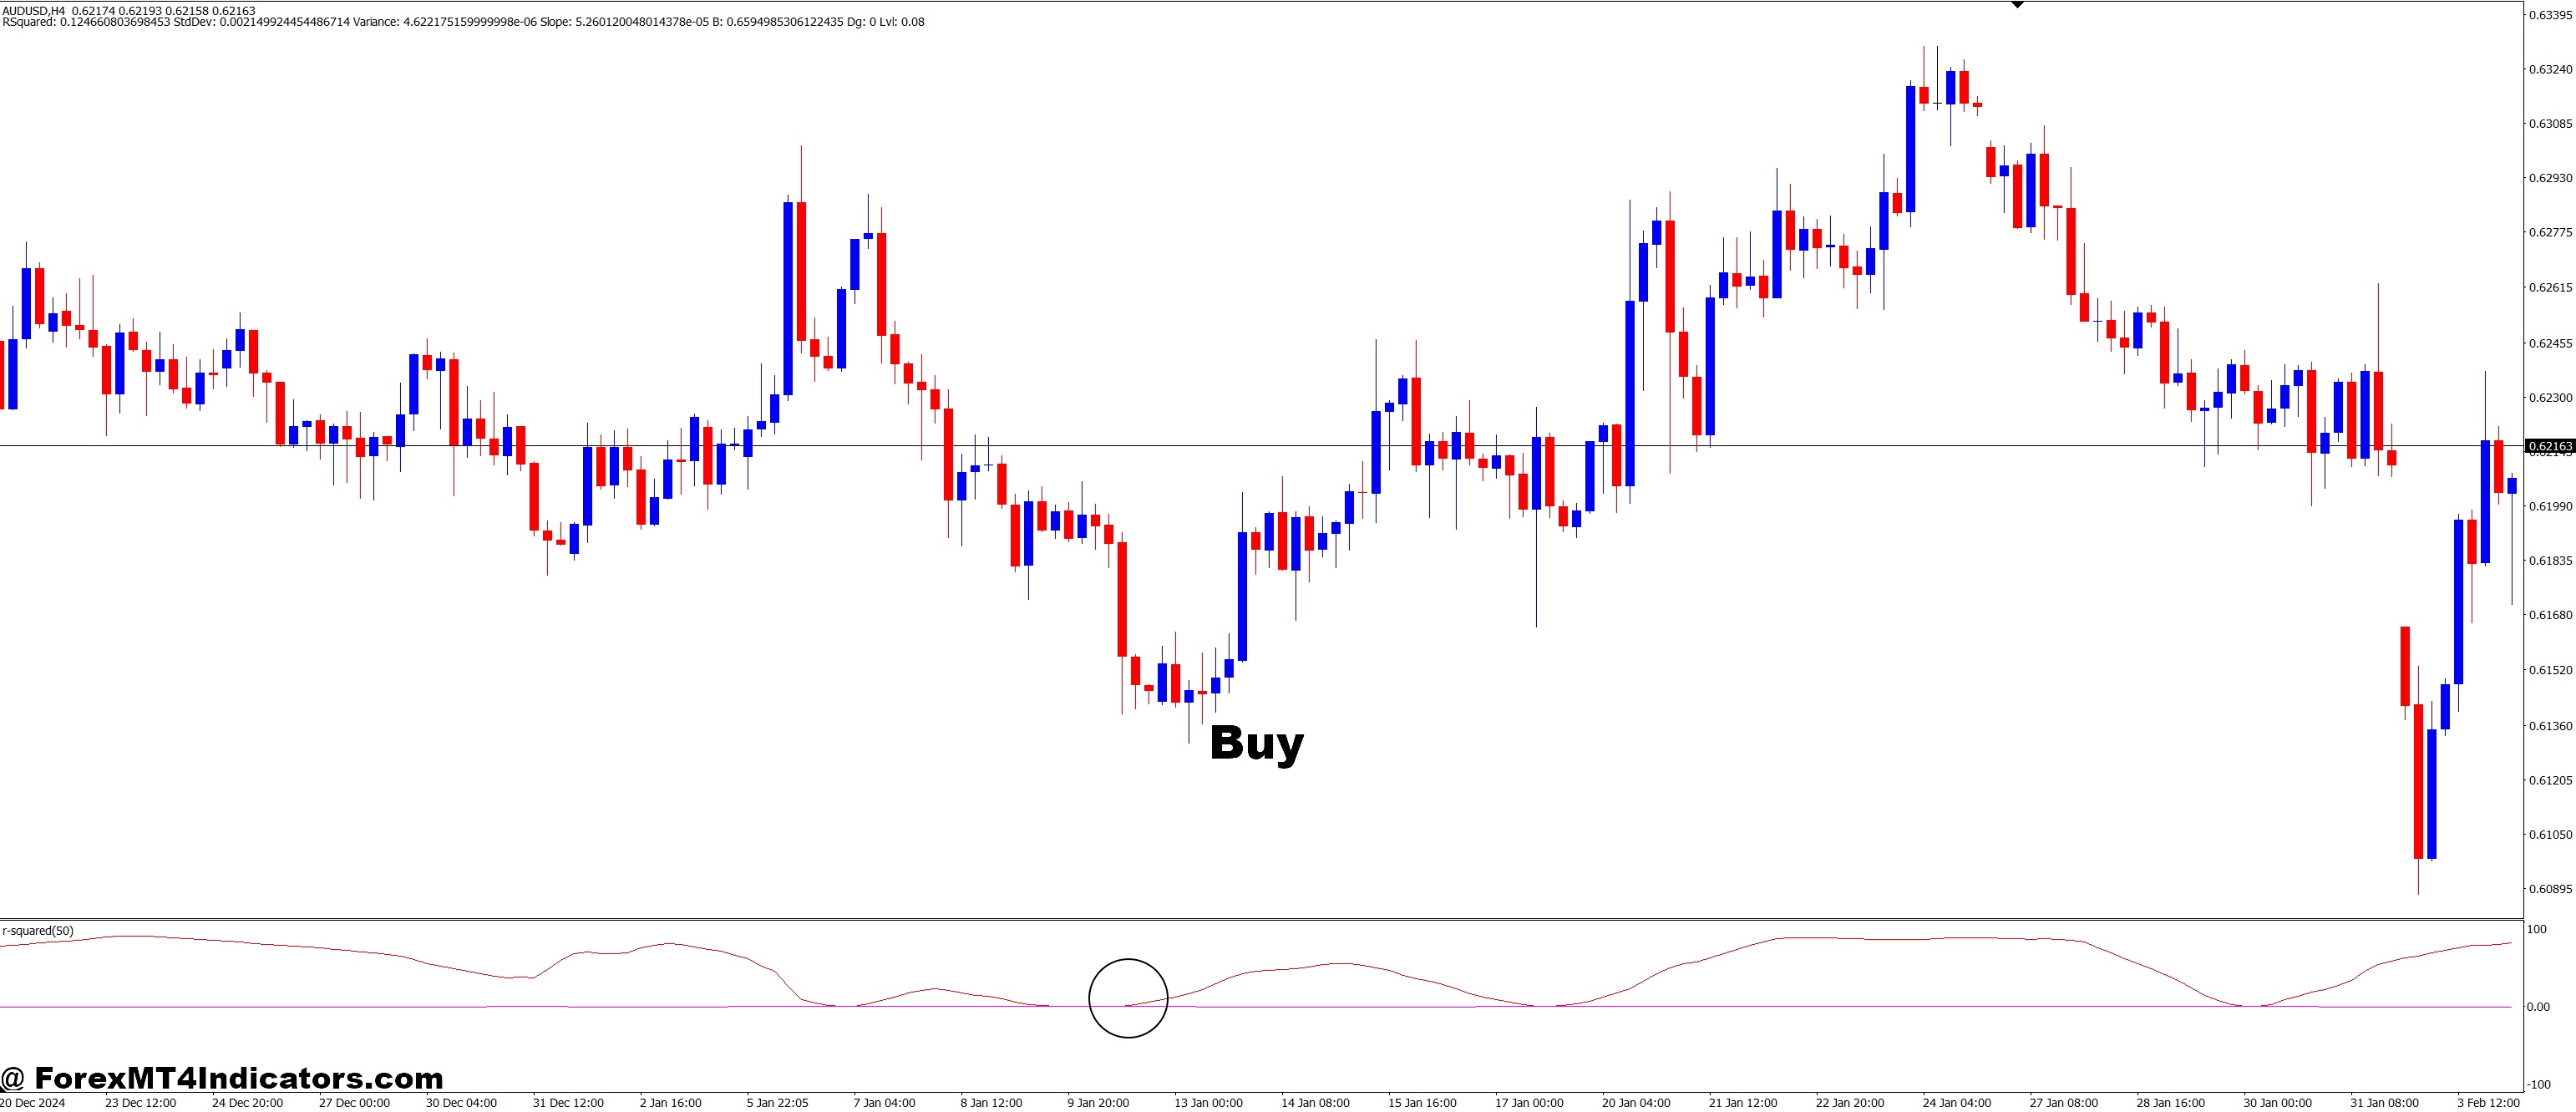
Buy Entry

- R-Squared Value: Look for an R-Squared value above 0.80 (strong correlation), indicating a strong and reliable trend.
- Linear Regression Line: Ensure the price is above the Linear Regression line, confirming an uptrend.
- Price Pullback: Wait for a brief pullback or price retracement toward the Linear Regression line or support level.
- Confirmation: Once the price retraces and starts moving back in the direction of the trend (upward), enter a buy trade.
- Support Level: Confirm that the price is bouncing off a support level or a key moving average (if applicable).
- Trend Continuation: The trend should be clear, with the price consistently moving higher, supported by the R-squared and Linear Regression alignment.
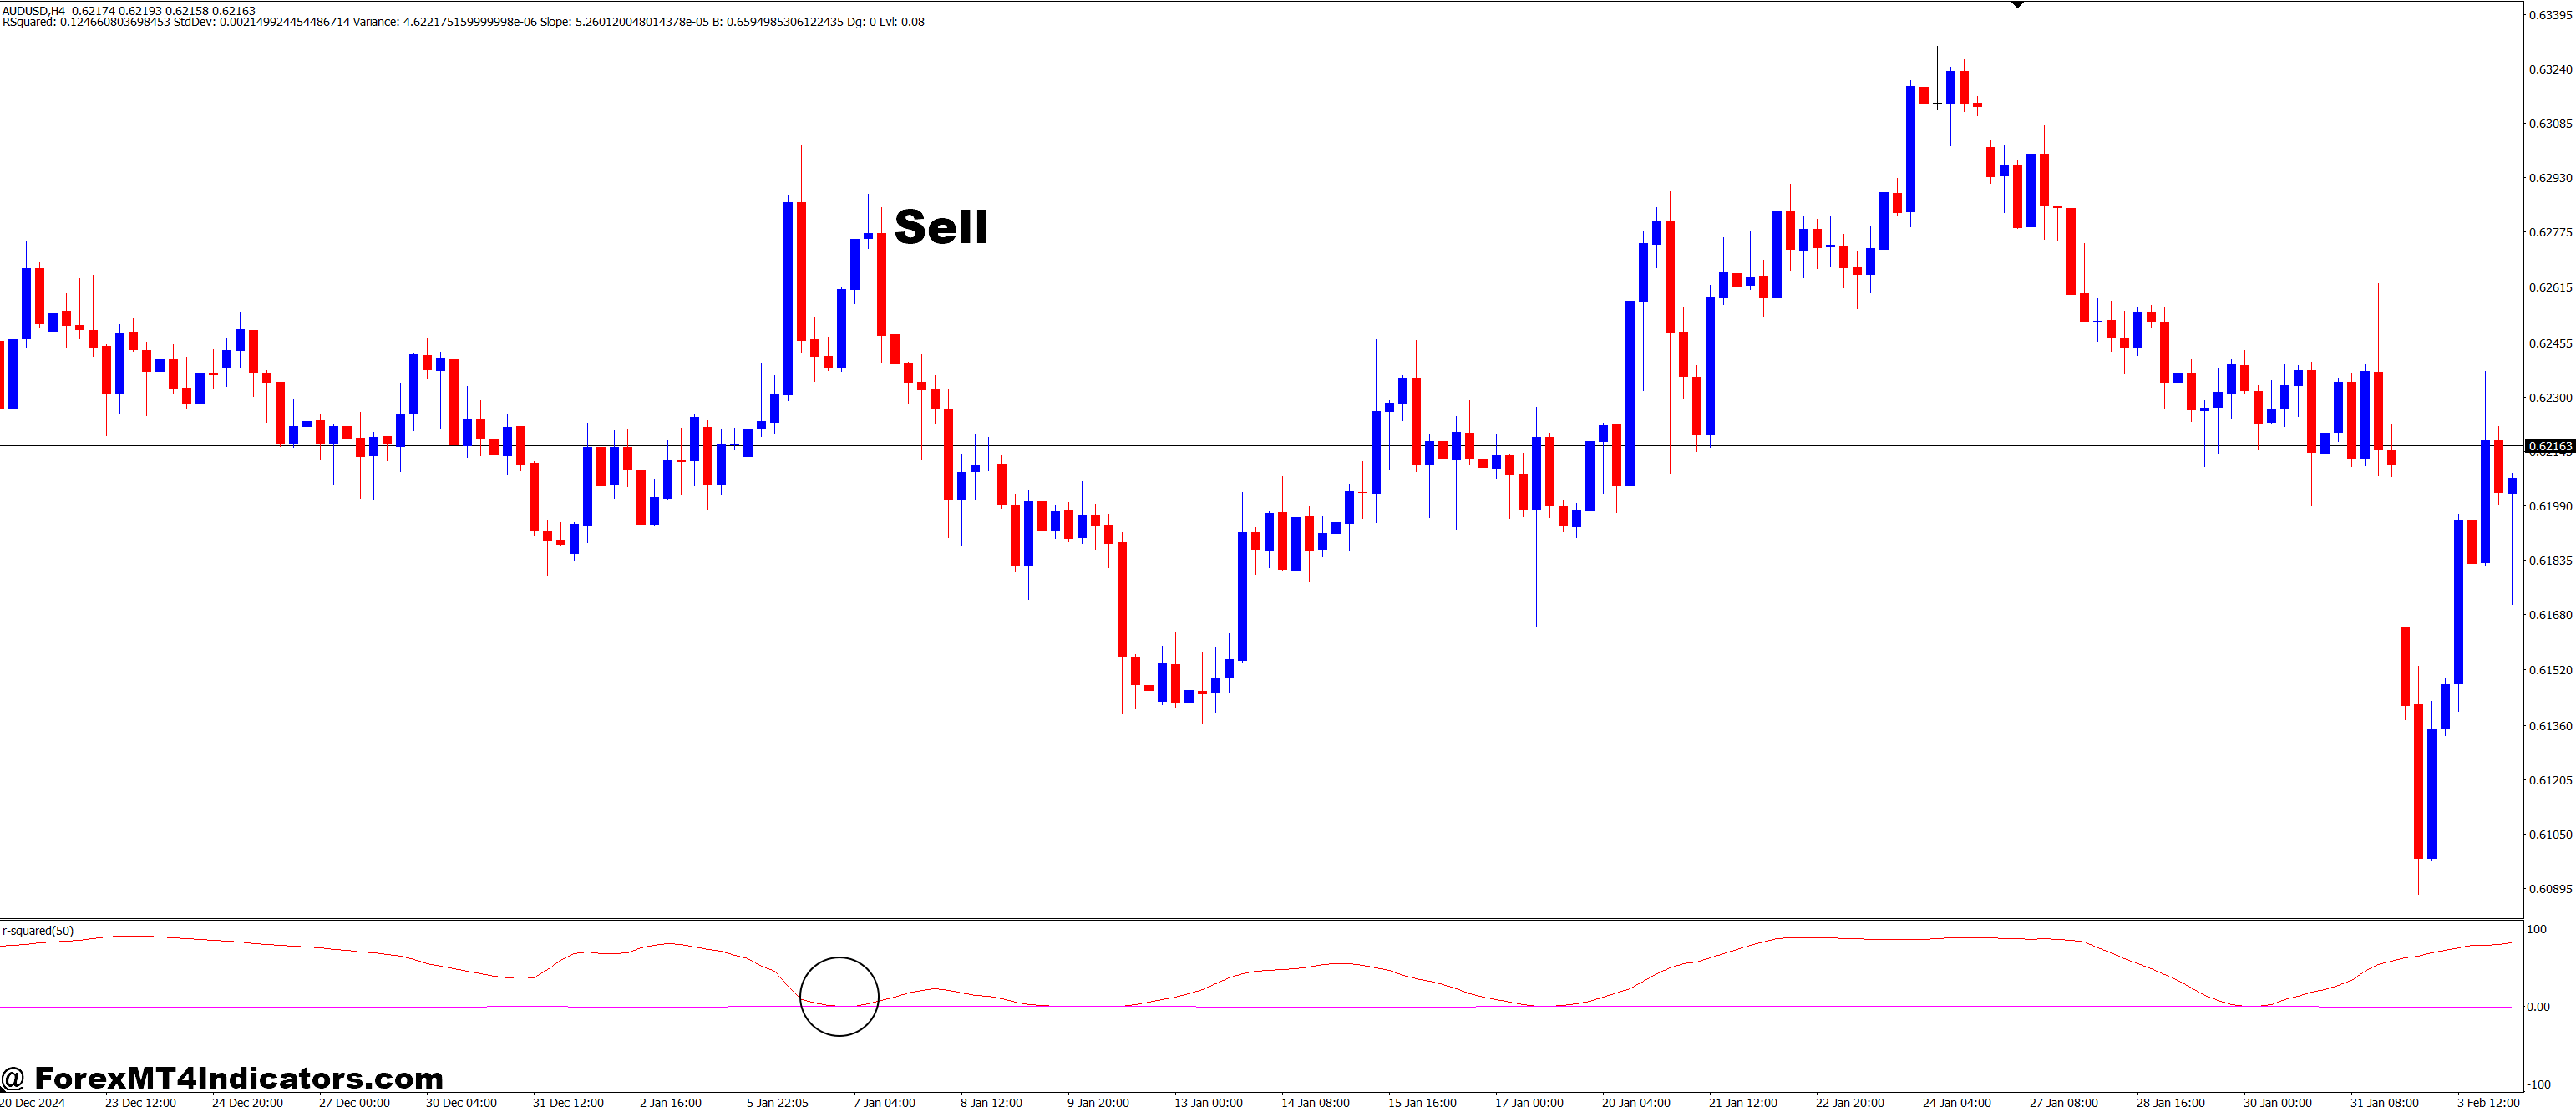
Sell Entry

- R-Squared Value: Look for an R-Squared value above 0.80 (strong correlation), indicating a strong and reliable trend.
- Linear Regression Line: Ensure the price is below the Linear Regression line, confirming a downtrend.
- Price Retracement: Wait for a brief retracement or pullback towards the Linear Regression line or resistance level.
- Confirmation: When the price starts moving back down after the retracement, enter a sell trade.
- Resistance Level: Confirm that the price is facing resistance or a key moving average (if applicable).
- Trend Continuation: The downtrend should be evident, with the price consistently moving lower, confirmed by the alignment of the R-squared and Linear Regression indicators.
Conclusion
The R-squared and Linear Regression MT4 indicators are powerful tools that help traders better understand market trends, predict future price movements, and make more informed decisions. By using these indicators together, traders can better understand market dynamics, confirm trends, and manage risk more effectively. Although no tool is foolproof, the combination of R-squared and Linear Regression can greatly enhance a trader’s chances of success. With proper use and a well-rounded strategy, these indicators can provide a significant edge in the competitive trading world.
Recommended MT4/MT5 Broker
XM Broker
- Free $50 To Start Trading Instantly! (Withdraw-able Profit)
- Deposit Bonus up to $5,000
- Unlimited Loyalty Program
- Award Winning Forex Broker
- Additional Exclusive Bonuses Throughout The Year
- Exclusive 50% Cash Rebates for all Trades!

>> Sign Up for XM Broker Account here with Exclusive 50% Cash Rebates For All Future Trades [Use This Special Invitation Link] <<
Already an XM client but missing out on cashback? Open New Real Account and Enter this Partner Code: 𝟕𝐖𝟑𝐉𝐐
(Free MT4 Indicators Download)

||
-----------------------------------------------------
By: Tim Morris
Title: R-Squard and Linear Regression MT4 Indicator
Sourced From: forexmt4indicators.com/r-squard-and-linear-regression-mt4-indicator/?utm_source=rss&utm_medium=rss&utm_campaign=r-squard-and-linear-regression-mt4-indicator
Published Date: Tue, 08 Apr 2025 07:00:26 +0000
Read More
.png) InvestingStocksToolsClubsVideosPrivacy PolicyTerms And Conditions
InvestingStocksToolsClubsVideosPrivacy PolicyTerms And Conditions
