||
The S&P 500 index is on a downward trend, and we also examine the dynamics of EUR, GBP, JPY, CHF, AUD, Brent, and Gold.
EUR/USD (Euro vs US Dollar)

EUR/USD (Euro vs US Dollar)The Euro vs US Dollar has broken the 1.0677 level down and may test this level from below. A decline to 1.0632 and then to 1.0540 is possible.
GBP/USD (Great Britain Pound vs US Dollar)

GBP/USD (Great Britain Pound vs US Dollar)The Great Britain Pound vs US Dollar has broken the 1.2233 level down and may decline to 1.2160 and then to 1.2097.
USD/JPY (US Dollar vs Japanese Yen)

USD/JPY (US Dollar vs Japanese Yen)The US Dollar vs Japanese Yen has broken the 151.00 level upwards and may extend the growth to 151.60 before a correction to 150.90 and then a rise to 152.20.
Discover the R MobileTrader app
Get a portable trading workstation on your phone. Click on the button and install the application!
USD/CHF (US Dollar vs Swiss Franc)
 USD/CHF (US Dollar vs Swiss Franc)
The US Dollar vs Swiss Franc has broken the 0.9022 level upwards, possibly rising to 0.9055 and then to 0.9133 after a correction.
AUD/USD (Australian Dollar vs US Dollar)
 AUD/USD (Australian Dollar vs US Dollar)
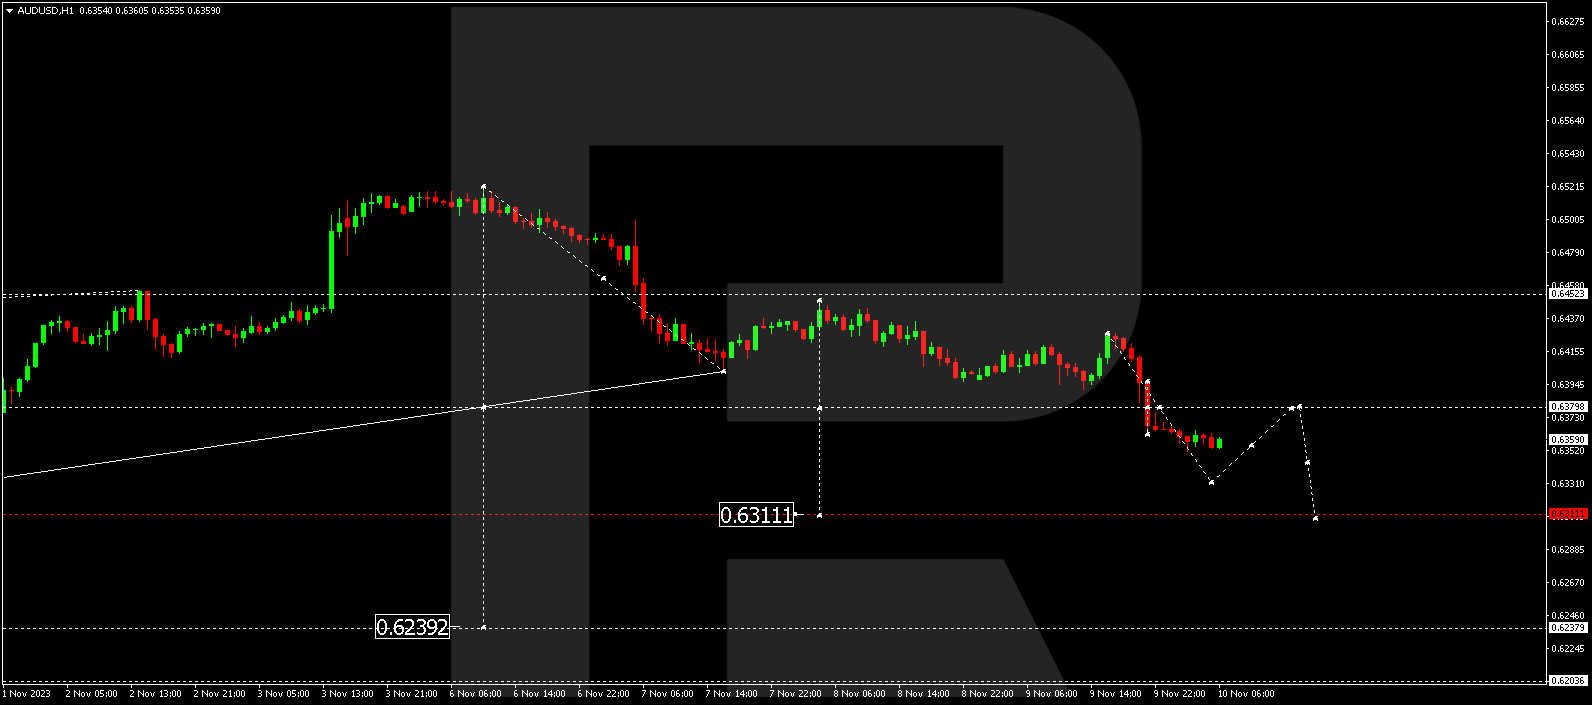
The Australian Dollar vs US Dollar has broken the 0.6380 level downwards and may decline to 0.6311 and then to 0.6240.
BRENT
 BRENT
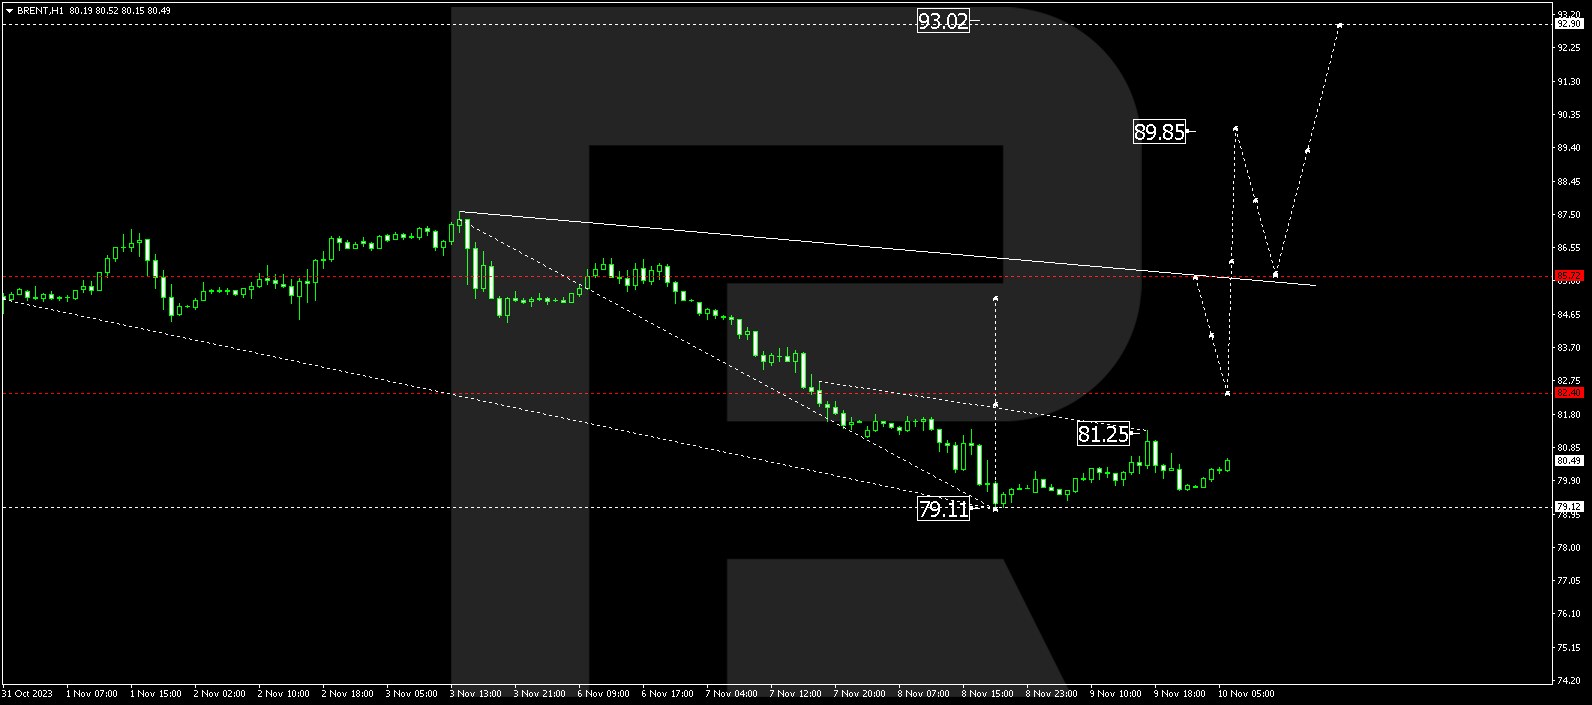
BRENTBrent has risen to 81.25, correcting to 79.66 and forming a new rising wave to 82.40, potentially continuing to 85.70.
XAU/USD (Gold vs US Dollar)
 XAU/USD (Gold vs US Dollar)
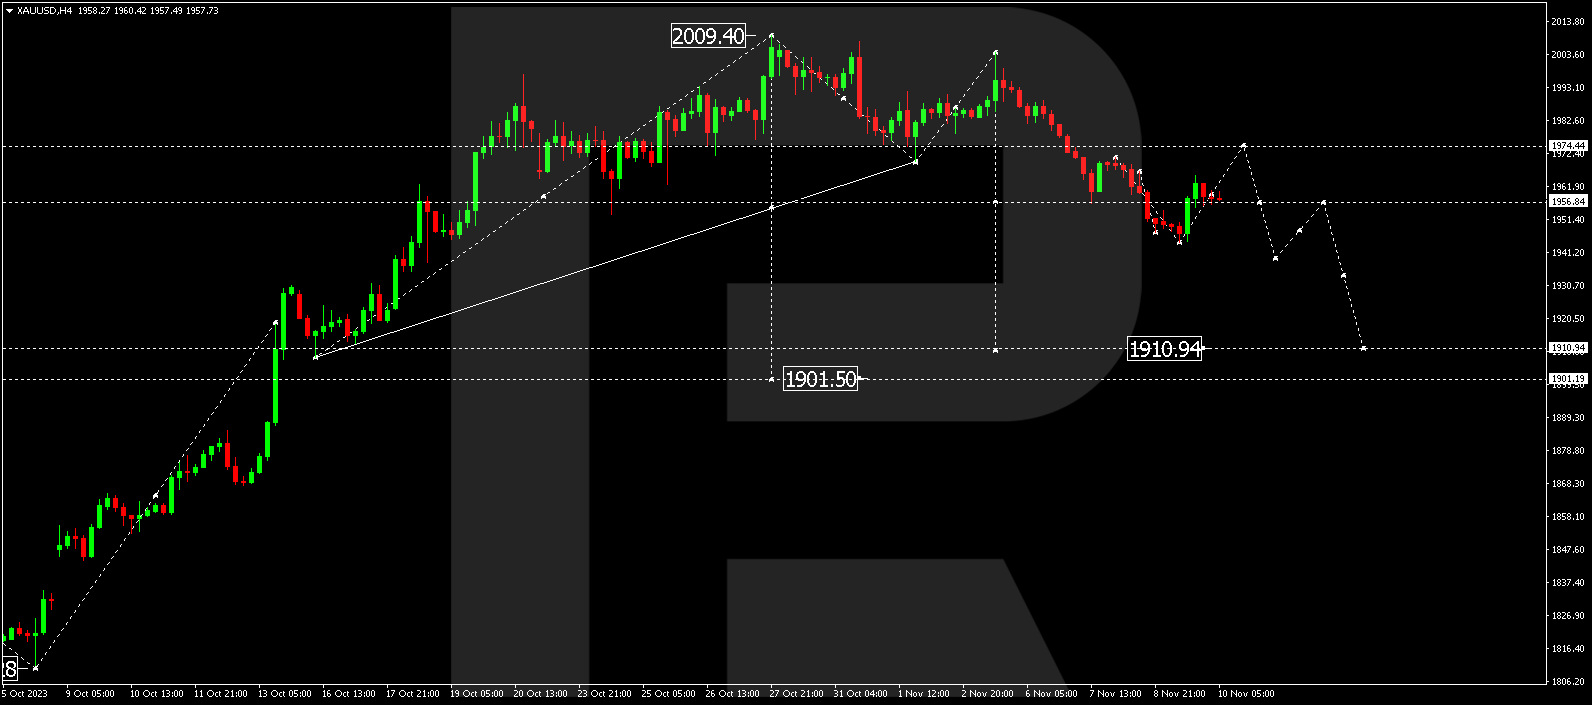
Gold has completed a declining wave to 1944.40 and may consolidate around this level before rising to 1974.44 and then declining to 1911.00.
S&P 500
 S&P 500
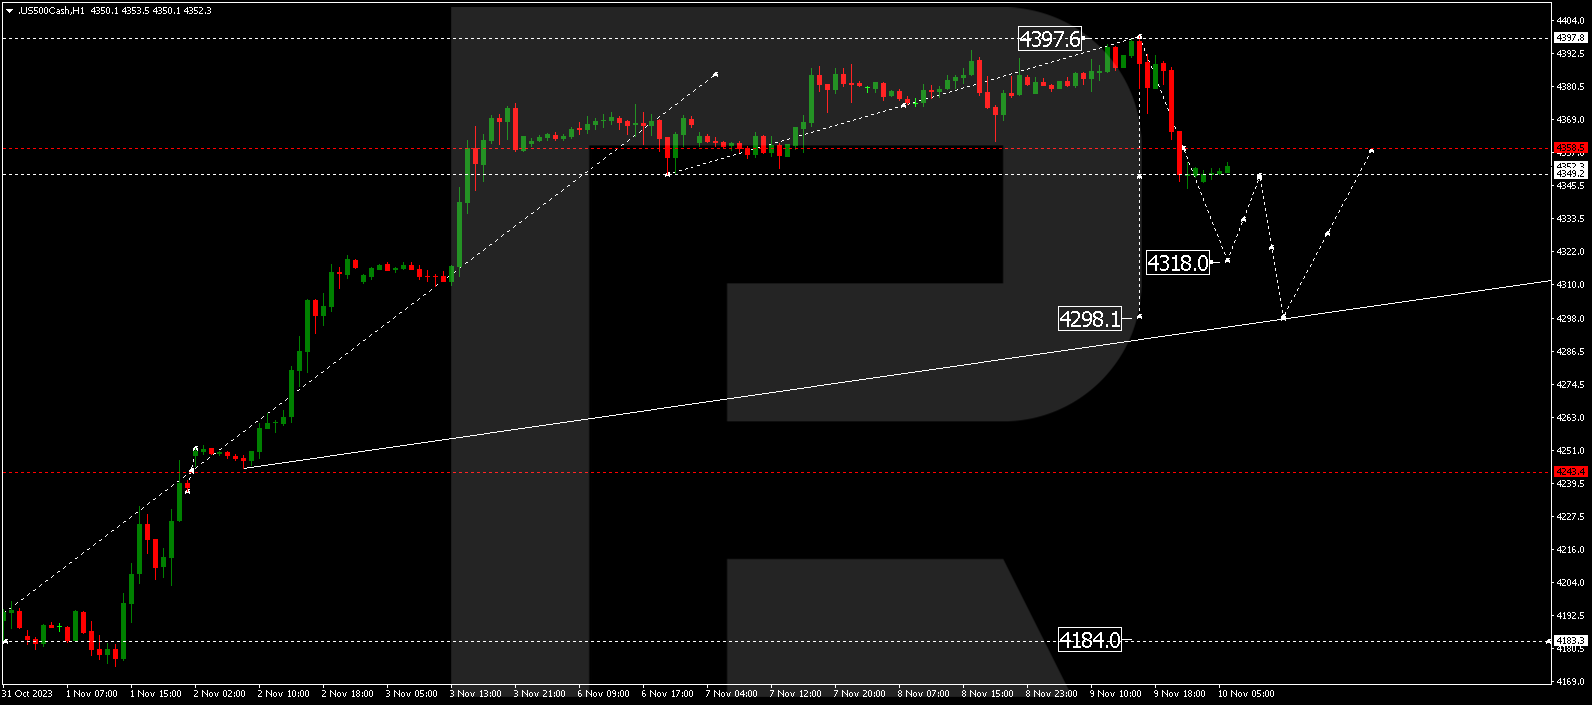
The stock index has broken the 4358.5 level downwards, completing a wave of decline to 4344.4 and may continue to 4318.0 before correcting to 4349.0 and dropping to 4298.0.
Open Trading Account
The post Technical Analysis & Forecast November 10, 2023 appeared first at R Blog - RoboForex.
||
-----------------------------------------------------
By: Igor Sayadov
Title: Technical Analysis & Forecast November 10, 2023
Sourced From: blog.roboforex.com/blog/2023/11/10/technical-analysis-forecast-november-10-2023/
Published Date: Fri, 10 Nov 2023 09:15:24 +0000
Read More
.png) InvestingStocksToolsClubsVideosPrivacy PolicyTerms And Conditions
InvestingStocksToolsClubsVideosPrivacy PolicyTerms And Conditions
