||
The DSI stands as a testament to the ingenuity of technical analysis. It builds upon the strengths of two established indicators: the Relative Strength Index (RSI) and the Stochastic Oscillator. By combining these tools, the DSI offers a potentially more refined and nuanced perspective on market momentum.
Here’s a quick breakdown of the DSI’s appeal:
- Enhanced Sensitivity: The double application of stochastic principles can lead to a more sensitive indicator, potentially highlighting subtle shifts in market sentiment that might escape other tools.
- Improved Filtering: The DSI’s layered calculation can act as a built-in filter, potentially reducing the number of false signals generated by its constituent indicators.
- Overbought/Oversold Identification: Like its predecessors, the DSI excels at pinpointing potential overbought and oversold zones, aiding traders in identifying potential trend reversals.
Understanding the Calculation of the Double Stochastic RSI
The DSI’s calculation might seem intimidating at first glance, but understanding the core principles empowers you to interpret its signals effectively. Here’s a simplified breakdown:
- The Underlying RSI: The DSI first calculates the standard RSI value based on a chosen period (typically 14 days). This value reflects the recent closing price movements, providing a gauge of momentum.
- Stochastic Transformation: The RSI value is then transformed using a stochastic oscillator formula. This essentially creates a new oscillator that oscillates between 0 and 100, reflecting the RSI’s position relative to its recent highs and lows.
- Double Stochastic Application: Finally, this “preliminary” stochastic value is subjected to the same stochastic transformation again. This double application adds another layer of smoothing and filtering, potentially leading to a more refined indicator.
The DSI typically displays two lines:
- %K: The primary line, represents the latest double stochastic value.
- %D: A slower-moving line that acts as a signal line, often a moving average of %K.
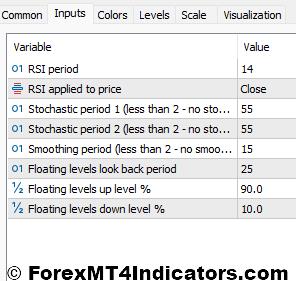
Several key parameters influence the DSI’s behavior:
- RSI Period: This determines the timeframe used to calculate the underlying RSI. A shorter period increases sensitivity but can also lead to more noise.
- Stochastic %K Period: This defines the timeframe used for the first stochastic transformation. Similar to the RSI period, a shorter period leads to a more reactive indicator.
- Stochastic %D Period (Moving Average): This sets the timeframe for the moving average applied to %K, determining the smoothness of the %D signal line.
Interpreting the Double Stochastic RSI Readings
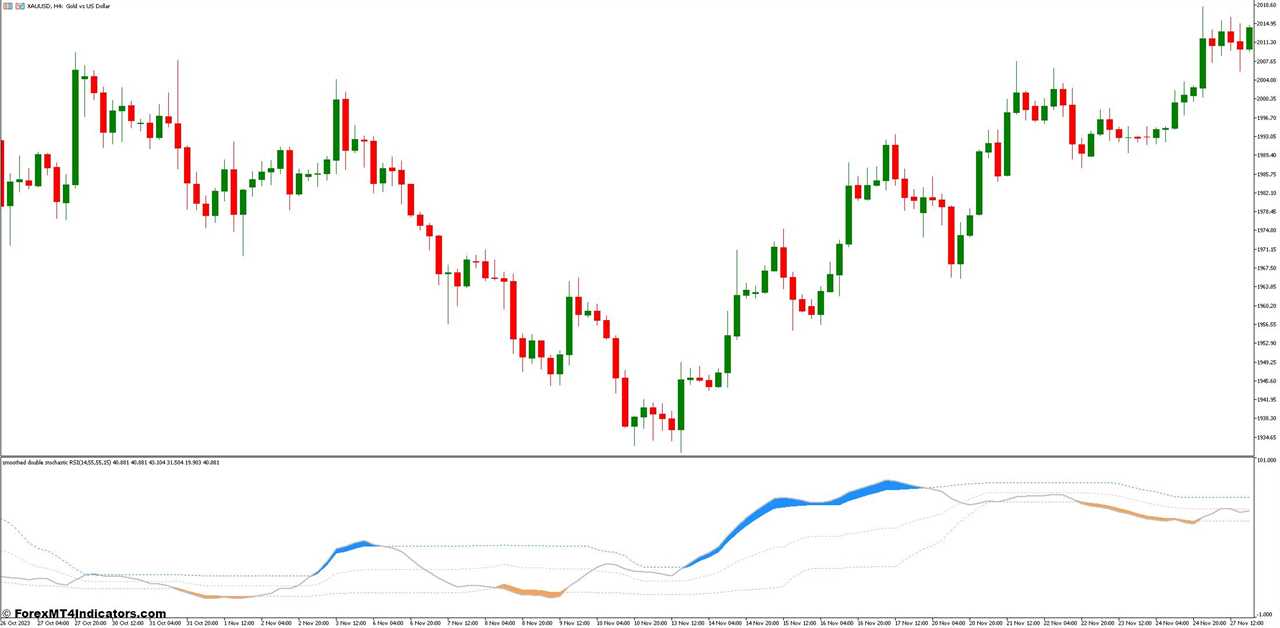
So, you’ve got the DSI up and running on your MetaTrader 5 platform. Now comes the crucial part: interpreting its signals.
The DSI typically oscillates between 0 and 100, with zones often designated as:
- Oversold (Below 20): This area suggests the asset may be oversold, potentially ripe for a bullish reversal.
- Neutral (Between 20 and 80): This zone indicates a period of consolidation, where the market direction is unclear.
- Overbought (Above 80): This area suggests the asset may be overbought, potentially vulnerable to a bearish reversal.
- Divergence: Look for divergences between the DSI and price action. When the DSI makes a new high (or low) but the price fails to follow suit, it can signal a potential trend reversal. Bullish divergence occurs when the DSI is rising while the price is falling, and vice versa for bearish divergence.
- Confirmation with Price Action: Don’t trade based on the DSI alone. Look for confirmation from price patterns, support and resistance levels, or other indicators to strengthen your trading signals.
- Trend Context: Consider the prevailing market trend. The DSI’s readings can hold more weight in a ranging market compared to a strong trending environment.
Advanced Applications
The DSI’s versatility extends beyond basic overbought/oversold identification. Here are some advanced applications to consider:
- Multi-Timeframe Analysis: Analyze the DSI on different timeframes (e.g., daily, hourly) to gain insights into both short-term and long-term trends. A confluence of signals across multiple timeframes can strengthen your trading conviction.
- Filtering Trades: Use the DSI as a filter for other trading signals. For instance, you might only consider trading long signals from your primary indicator when the DSI is also suggesting an oversold condition.
- Combining with Volume Analysis: Integrate volume analysis with the DSI. High-volume confirmation alongside a DSI signal can add confidence to your trade decisions.
Customization and Backtesting
The beauty of the DSI lies in its customizability. As mentioned earlier, you can adjust the RSI period, stochastic %K period, and %D moving average period to tailor the indicator to your preferences. Here’s how to get the most out of customization:
- Experiment with Different Settings: Try various parameter combinations to see how they affect the DSI’s responsiveness and filter out noise.
- Backtesting is Key: Once you’ve identified a promising configuration, backtest your strategy on historical data. This allows you to evaluate its effectiveness and identify potential shortcomings before risking real capital.
- Sharpen Your Trading Edge: Through customization and backtesting, you can refine your DSI-based trading approach, potentially leading to a sharper trading edge.
How to Trade with the Double Stochastic RSI
Buy Entry
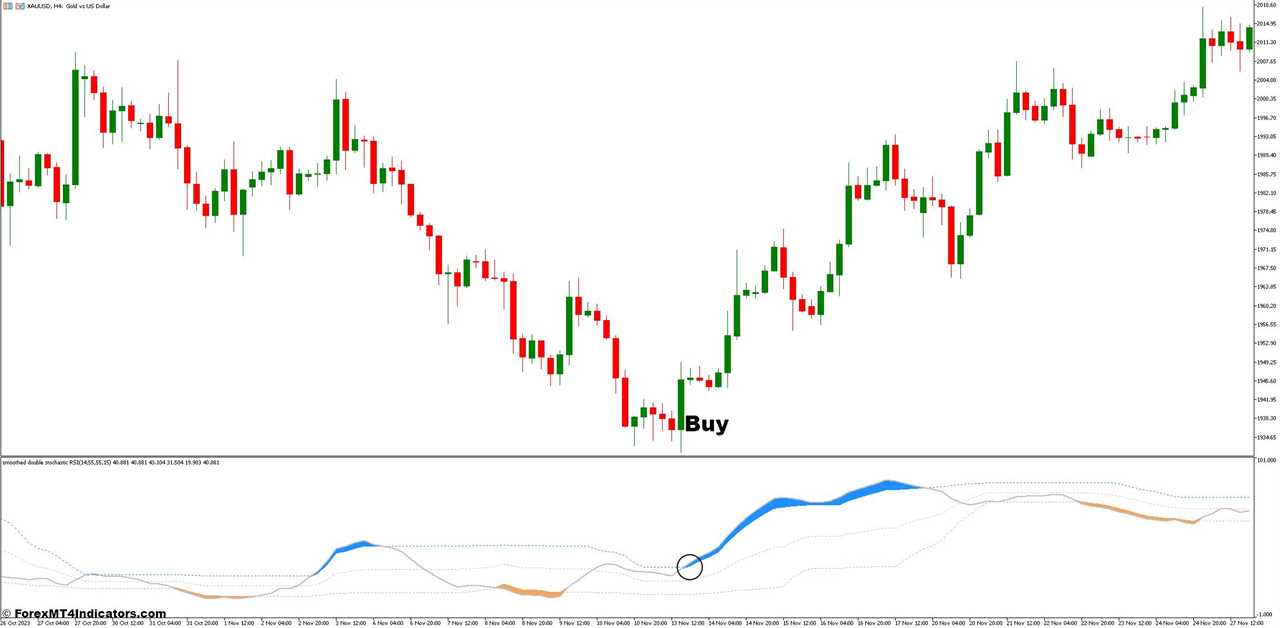
- DSI dips below 20 (oversold territory).
- Bullish divergence present (DSI rising while price falls).
- Entry: Consider buying near a support level or on a bullish price reversal candlestick pattern (e.g., hammer, engulfing bullish).
- Stop-Loss: Place a stop-loss order below the recent swing low or support level.
- Take-Profit: Target a profit level near the midpoint of the overbought zone (around 50) or utilize a trailing stop-loss to capture potential trends.
Sell Entry
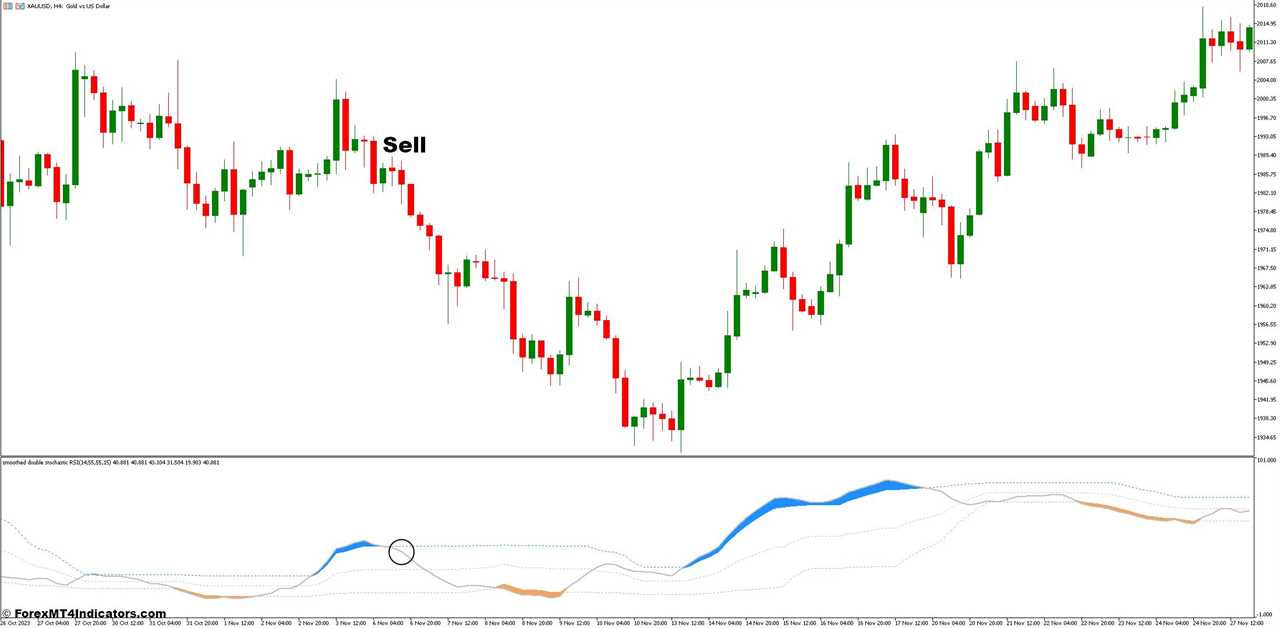
- DSI climbs above 80 (overbought territory).
- Bearish divergence present (DSI falling while price rises).
- Entry: Consider selling near a resistance level or on a bearish price reversal candlestick pattern (e.g., shooting star, bearish engulfing).
- Stop-Loss: Place a stop-loss order above the recent swing high or resistance level.
- Take-Profit: Target a profit level near the midpoint of the oversold zone (around 50) or utilize a trailing stop-loss to capture potential downtrends.
Double Stochastic RSI Indicator Settings
Conclusion
The Double Stochastic RSI stands as a valuable tool in the arsenal of a discerning MetaTrader 5 user. By understanding its calculation, interpreting its signals effectively, and employing it within a robust trading strategy, you can potentially gain valuable insights into market sentiment and identify high-probability trading opportunities.
Recommended MT4/MT5 Brokers
XM Broker
- Free $50 To Start Trading Instantly! (Withdraw-able Profit)
- Deposit Bonus up to $5,000
- Unlimited Loyalty Program
- Award Winning Forex Broker
- Additional Exclusive Bonuses Throughout The Year

>> Sign Up for XM Broker Account here <<
FBS Broker
- Trade 100 Bonus: Free $100 to kickstart your trading journey!
- 100% Deposit Bonus: Double your deposit up to $10,000 and trade with enhanced capital.
- Leverage up to 1:3000: Maximizing potential profits with one of the highest leverage options available.
- ‘Best Customer Service Broker Asia’ Award: Recognized excellence in customer support and service.
- Seasonal Promotions: Enjoy a variety of exclusive bonuses and promotional offers all year round.

>> Sign Up for FBS Broker Account here <<

(Free MT4 Indicators Download)
Click here below to download:
Double Stochastic RSI MT5 Indicator
||
-----------------------------------------------------
By: Tim Morris
Title: Double Stochastic RSI MT5 Indicator
Sourced From: www.forexmt4indicators.com/double-stochastic-rsi-mt5-indicator/?utm_source=rss&utm_medium=rss&utm_campaign=double-stochastic-rsi-mt5-indicator
Published Date: Sat, 25 May 2024 01:00:29 +0000
Read More
.png) InvestingStocksToolsClubsVideosPrivacy PolicyTerms And Conditions
InvestingStocksToolsClubsVideosPrivacy PolicyTerms And Conditions
