||
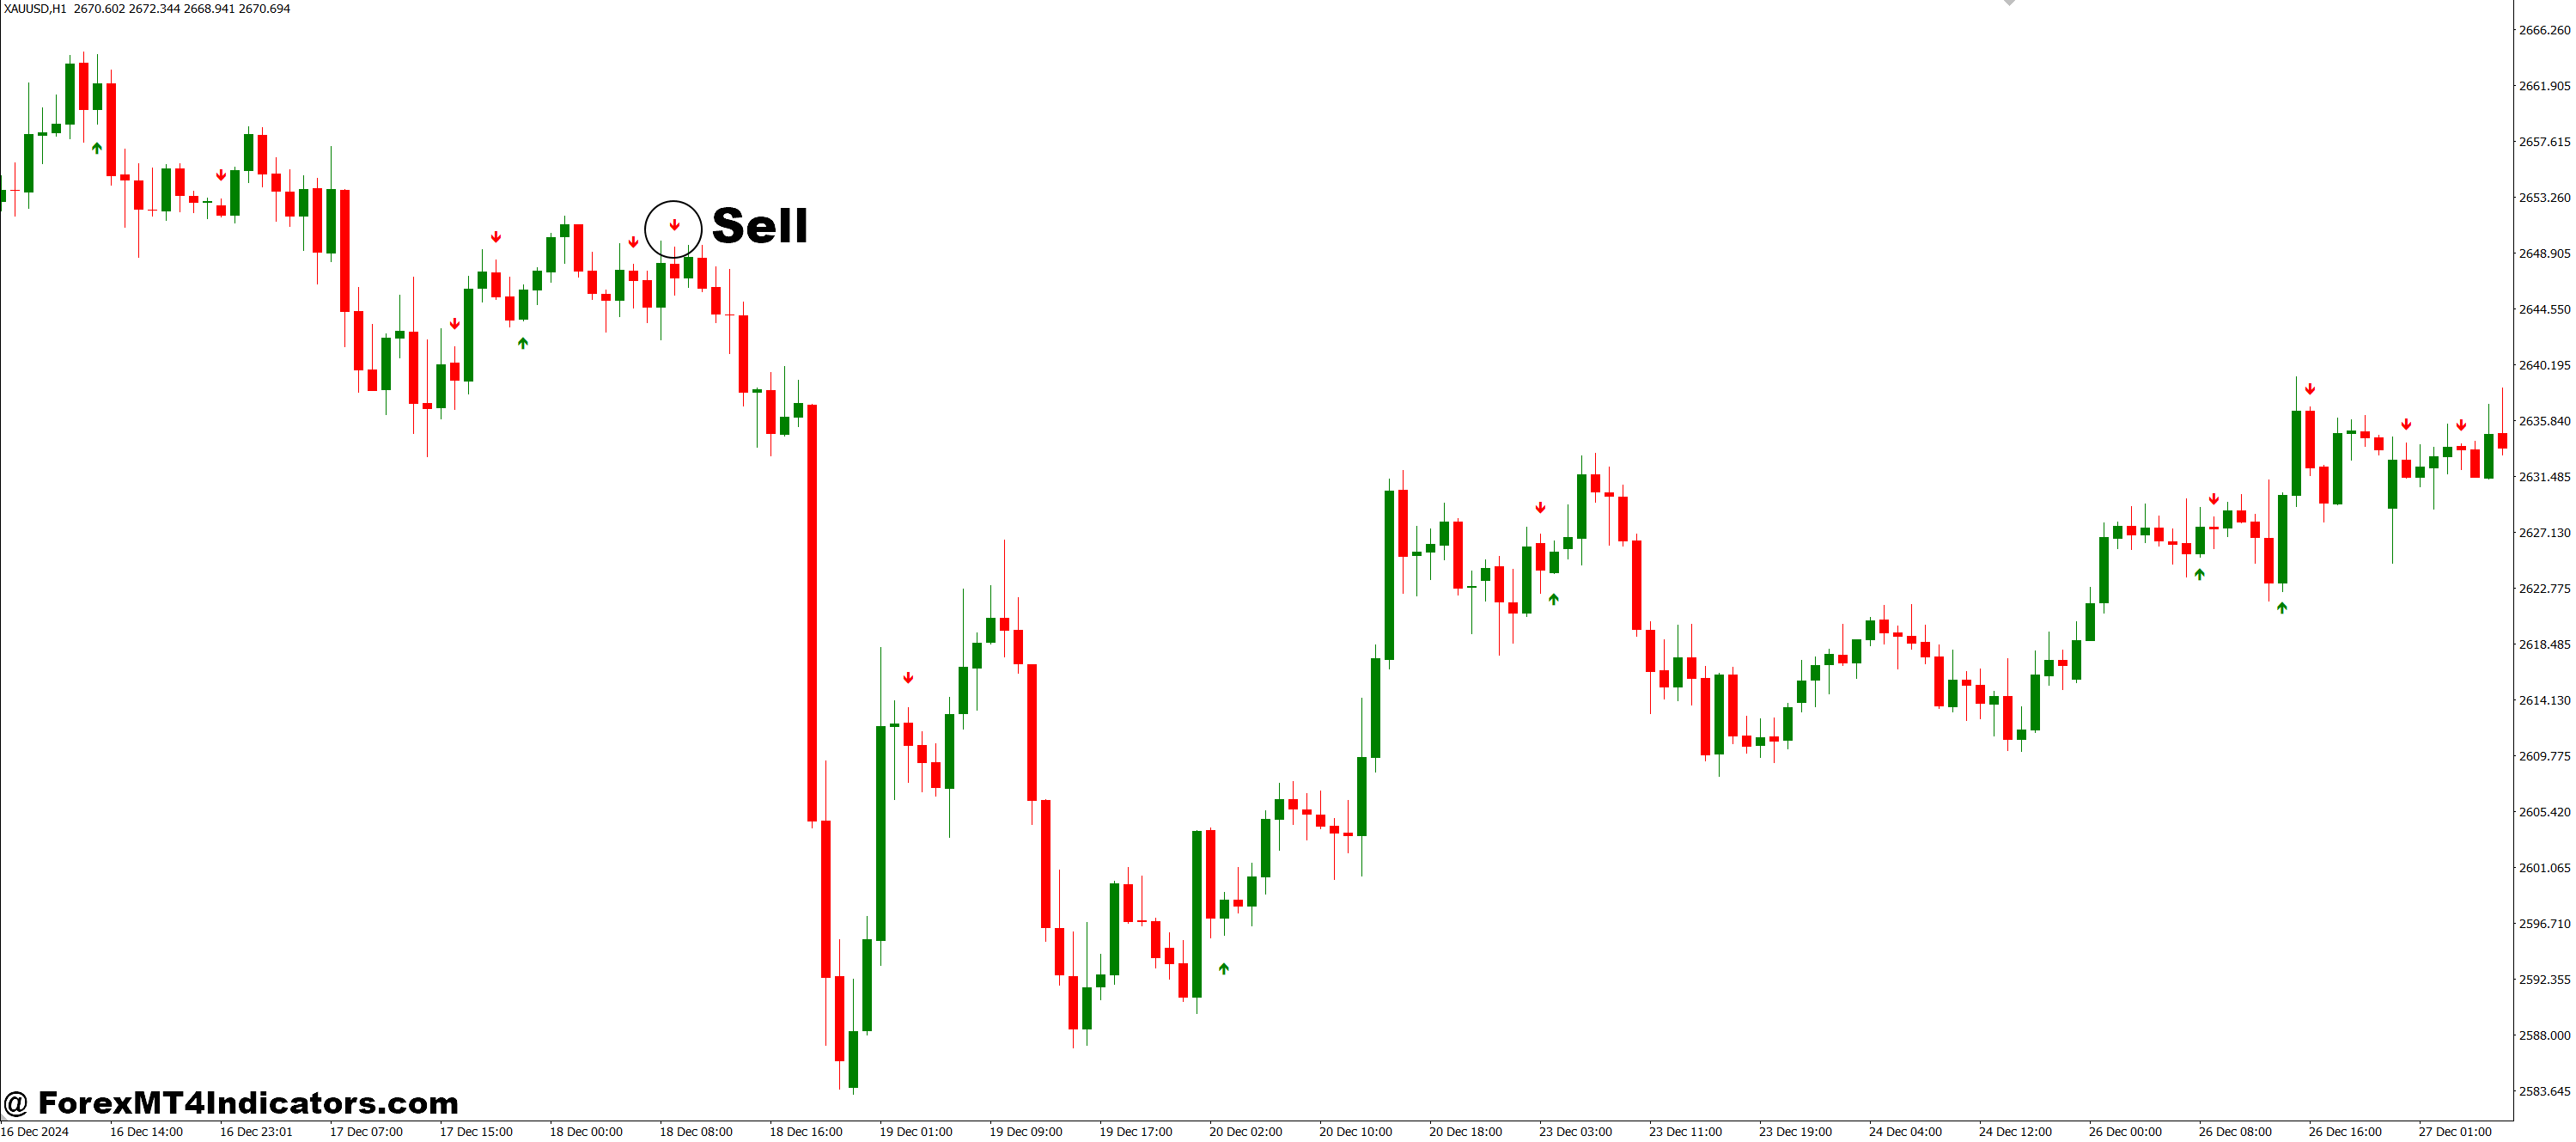
The Harami MA RSI MACD is a unique MT4 indicator that blends three powerful tools: the Harami candlestick pattern, Moving Averages (MA), and momentum indicators like RSI and MACD. These indicators work together to filter out noise and give strong entry and exit signals. Instead of using separate charts, everything is combined in one visual, making analysis quicker and easier.
This indicator highlights Harami patterns (a common reversal signal), while checking if the RSI is overbought or oversold and confirming trend direction using the MACD. It helps reduce false signals by only alerting traders when multiple conditions align.
Why It Matters for Traders
A lot of traders rely on guesswork when it comes to timing the market. Even if they spot a pattern like Harami, they might not know if it’s strong enough to act on. This tool removes that uncertainty. If the Harami pattern shows up, and both the RSI and MACD support a reversal or trend continuation, the trader has a higher chance of success.
The indicator’s design helps filter out weak patterns. It only highlights setups when the moving average agrees with the overall direction and the momentum supports it. This increases the probability of success, especially in volatile sessions like the New York or London open.
How It Helps in Real-Time Trading

The Harami MA RSI MACD is especially helpful for intraday traders and swing traders. It’s easy to spot alerts directly on the chart, and many versions include sound or pop-up notifications. Whether someone is trading forex, gold, or indices, this indicator can work on any pair or time frame.
Instead of analyzing each component manually, the trader gets a full setup displayed clearly, saving time and boosting confidence. With fewer false signals and better timing, it becomes easier to manage risk and improve decision-making on the spot.
How to Trade with Harami MA RSI MACD MT4 Indicator
Buy Entry

- A Bullish Harami candlestick pattern appears on the chart.
- The RSI is below 30 (oversold zone), showing potential for upward movement.
- The MACD histogram crosses above the zero line, or the MACD line crosses above the signal line.
- Price is above the Moving Average or just crossing above it (trend reversal sign).
- Wait for the candle to close before entering the trade to confirm the pattern.
- Place a stop-loss just below the recent swing low.
Sell Entry

- A Bearish Harami candlestick pattern shows up.
- The RSI is above 70 (overbought zone), suggesting a possible drop.
- The MACD histogram crosses below the zero line, or the MACD line crosses below the signal line.
- The price is below the Moving Average or just crossing below it.
- Confirm with candle close before opening the position.
- Set stop-loss just above the recent swing high.
Conclusion
The Harami MA RSI MACD MT4 Indicator is like having three tools in one. It simplifies trading by bringing together reliable patterns, trend strength, and momentum in a single view. For traders in the U.S. looking to boost their technical edge, this tool helps reduce the noise and focus on strong, actionable setups. Whether you’re new or experienced, using this combined approach can help you trade smarter, not harder.
Recommended MT4/MT5 Broker
XM Broker
- Free $50 To Start Trading Instantly! (Withdraw-able Profit)
- Deposit Bonus up to $5,000
- Unlimited Loyalty Program
- Award Winning Forex Broker
- Additional Exclusive Bonuses Throughout The Year
- Exclusive 50% Cash Rebates for all Trades!

>> Sign Up for XM Broker Account here with Exclusive 50% Cash Rebates For All Future Trades [Use This Special Invitation Link] <<
Already an XM client but missing out on cashback? Open New Real Account and Enter this Partner Code: 𝟕𝐖𝟑𝐉𝐐
(Free MT4 Indicators Download)

||
-----------------------------------------------------
By: Tim Morris
Title: Harami MA RSI MACD MT4 Indicator
Sourced From: forexmt4indicators.com/harami-ma-rsi-macd-mt4-indicator/?utm_source=rss&utm_medium=rss&utm_campaign=harami-ma-rsi-macd-mt4-indicator
Published Date: Wed, 18 Jun 2025 07:00:20 +0000
Read More
.png) InvestingStocksToolsClubsVideosPrivacy PolicyTerms And Conditions
InvestingStocksToolsClubsVideosPrivacy PolicyTerms And Conditions
