||
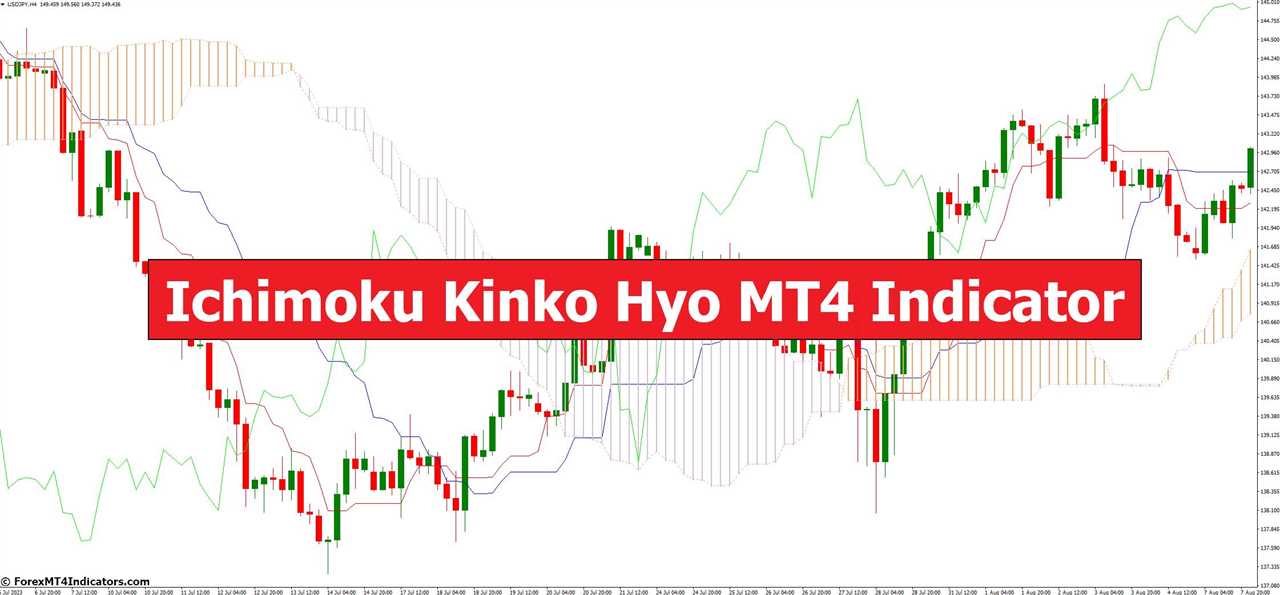
In the world of forex trading, making informed decisions is paramount to success. Traders are constantly seeking tools and indicators to help them analyze the markets effectively. One such powerful tool is the Ichimoku Kinko Hyo MT4 Indicator. In this article, we will delve into the intricacies of this indicator, exploring its features, benefits, and how it can be a game-changer for traders.
Understanding Ichimoku Kinko Hyo
Ichimoku Kinko Hyo, often referred to as just “Ichimoku,” is a versatile technical analysis tool developed by Japanese journalist Goichi Hosoda in the late 1960s. It provides a comprehensive view of price action, helping traders identify trends, support and resistance levels, and potential reversals.
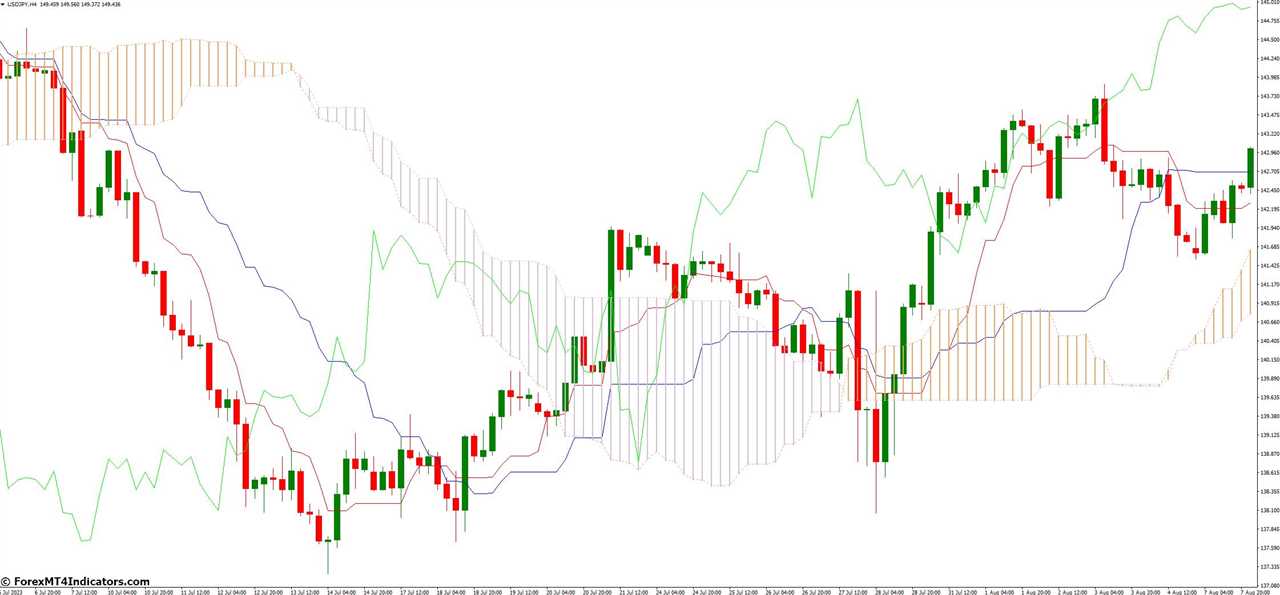
Components of the Indicator
Tenkan-sen (Conversion Line)
The Tenkan-sen, or Conversion Line, represents the average of the highest high and lowest low over a specific period, usually 9 periods. It offers insights into short-term price momentum.
Kijun-sen (Base Line)
The Kijun-sen, or Base Line, calculates the average of the highest high and lowest low over a longer period, typically 26 periods. This line provides a view of medium-term price momentum.
Senkou Span A and B
These are two key components that form the “cloud” or “Kumo.” Senkou Span A is the midpoint between the Tenkan-sen and Kijun-sen, projected forward 26 periods. Senkou Span B calculates the average of the highest high and lowest low over the past 52 periods, projected forward 26 periods.
Chikou Span (Lagging Span)
The Chikou Span is the closing price of the current candle, shifted back 26 periods. It helps traders understand potential support and resistance levels.
How to Interpret Ichimoku Signals
Ichimoku provides various signals, including the Tenkan-Kijun crossover, Kumo breakout, and Chikou confirmation. These signals are crucial for traders in making buy or sell decisions.
Using Ichimoku in Trend Identification
Bullish Trends
Ichimoku identifies a bullish trend when the price is above the Kumo, and the Tenkan-sen is above the Kijun-sen. This indicates a strong upward momentum.
Bearish Trends
Conversely, a bearish trend is identified when the price is below the Kumo, and the Tenkan-sen crosses below the Kijun-sen. This suggests a strong downward momentum.
Support and Resistance Levels with Ichimoku
The Kumo, formed by Senkou Span A and B, serves as a dynamic support and resistance zone. Traders use it to identify potential entry and exit points.
Combining Ichimoku with Other Indicators
Many traders combine Ichimoku with other technical indicators like the Relative Strength Index (RSI) or Moving Averages to enhance their trading strategies.
Ichimoku Strategies for Traders
The Kumo Breakout Strategy
The Kumo breakout strategy involves entering a trade when the price breaks above or below the Kumo. It’s a popular strategy for identifying trend reversals.
The Tenkan-Kijun Crossover Strategy
This strategy is based on the crossover of the Tenkan-sen and Kijun-sen. Traders use it to identify potential entry and exit points.
Advantages of Ichimoku Kinko Hyo
Ichimoku offers several advantages, including its versatility, ability to identify trends, and its visual simplicity, making it accessible even to novice traders.
Potential Drawbacks
While powerful, Ichimoku may not be suitable for all trading styles or market conditions. It’s essential to understand its limitations.
Real-Life Examples of Ichimoku Analysis
Examining real-life examples of Ichimoku analysis can provide valuable insights into how this indicator is applied in actual trading scenarios.
How to Trade with Ichimoku Kinko Hyo MT4 Indicator
Buy Entry

- Look for the price to be above the cloud (Senkou Span A > Senkou Span B).
- Tenkan-Sen (Conversion Line) crosses above the Kijun-Sen (Base Line).
- Chikou Span (Lagging Span) is above the price from 26 periods ago.
Sell Entry
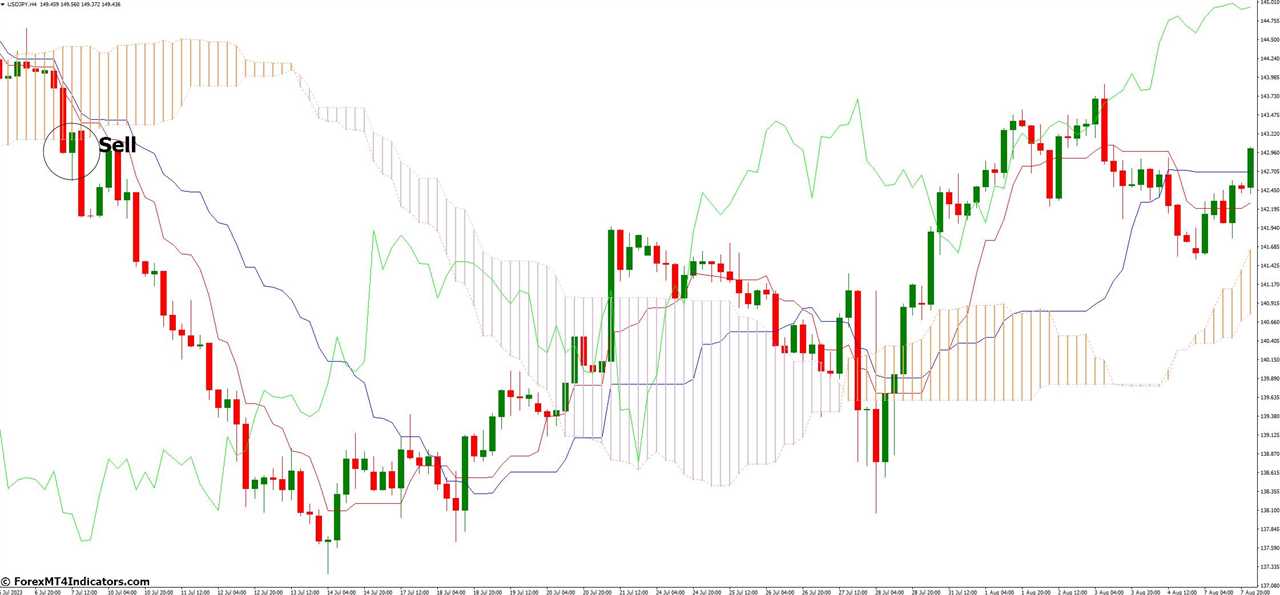
- Look for the price to be below the cloud (Senkou Span A < Senkou Span B).
- Tenkan-Sen (Conversion Line) crosses below the Kijun-Sen (Base Line).
- Chikou Span (Lagging Span) is below the price from 26 periods ago.
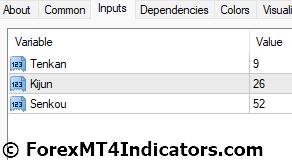
Ichimoku Kinko Hyo MT4 Indicator Settings
Conclusion
In conclusion, the Ichimoku Kinko Hyo MT4 Indicator is a potent tool for forex traders. Its comprehensive analysis capabilities, combined with strategic insights, make it a valuable addition to any trader’s toolbox. By mastering the art of Ichimoku, you can elevate your trading game and make more informed decisions in the dynamic world of forex.
FAQs
- Is Ichimoku suitable for day trading?
Ichimoku can be adapted for day trading, but it’s essential to use shorter timeframes and adjust parameters accordingly.
- Can Ichimoku be used in other financial markets besides forex?
Yes, Ichimoku can be applied to stocks, commodities, and other financial markets.
- What is the significance of the Kumo in the Ichimoku analysis?
The Kumo acts as a dynamic support and resistance zone, helping traders identify potential price reversals.
MT4 Indicators – Download Instructions
This is a Metatrader 4 (MT4) indicator and the essence of this technical indicator is to transform the accumulated history data.
This MT4 Indicator provides for an opportunity to detect various peculiarities and patterns in price dynamics which are invisible to the naked eye.
Based on this information, traders can assume further price movement and adjust their strategy accordingly. Click here for MT4 Strategies
Recommended Forex MetaTrader 4 Trading Platform
- Free $50 To Start Trading Instantly! (Withdrawable Profit)
- Deposit Bonus up to $5,000
- Unlimited Loyalty Program
- Award Winning Forex Broker
- Additional Exclusive Bonuses Throughout The Year

>> Claim Your $50 Bonus Here <<
How to install MT4 Indicator?
- Download the mq4 file.
- Copy mq4 file to your Metatrader Directory / experts / indicators /
- Start or restart your Metatrader 4 Client
- Select Chart and Timeframe where you want to test your MT4 indicators
- Search “Custom Indicators” in your Navigator mostly left in your Metatrader 4 Client
- Right click on the mq4 file
- Attach to a chart
- Modify settings or press ok
- And Indicator will be available on your Chart
How to remove MT4 Indicator from your Metatrader Chart?
- Select the Chart where is the Indicator running in your Metatrader 4 Client
- Right click into the Chart
- “Indicators list”
- Select the Indicator and delete
(Free Download)
Click here below to download:
Download Now
||
-----------------------------------------------------
By: Najeeb Anjam
Title: Ichimoku Kinko Hyo MT4 Indicator
Sourced From: www.forexmt4indicators.com/ichimoku-kinko-hyo-mt4-indicator/?utm_source=rss&utm_medium=rss&utm_campaign=ichimoku-kinko-hyo-mt4-indicator
Published Date: Fri, 17 Nov 2023 03:35:34 +0000
Read More
Did you miss our previous article...
https://peaceofmindinvesting.com/tools/technical-analysis-projection-november-17-2023
.png) InvestingStocksToolsClubsVideosPrivacy PolicyTerms And Conditions
InvestingStocksToolsClubsVideosPrivacy PolicyTerms And Conditions
